Are you struggling to understand mean, median, and mode? WHAT.EDU.VN provides a clear and concise explanation of these statistical measures, making complex concepts accessible to everyone. Discover how to calculate and apply these measures with ease, and improve your data analysis skills. Learn the differences between average, central tendency, and frequency distribution today!
1. Understanding Mean, Median, and Mode
Mean, median, and mode are fundamental concepts in statistics, each offering a unique way to describe the central tendency of a dataset. They help in understanding the typical or representative value within a set of numbers. Let’s break down each concept:
- Mean: The mean, often referred to as the average, is calculated by summing all the values in a dataset and dividing by the number of values. It’s a widely used measure and is sensitive to extreme values (outliers).
- Median: The median is the middle value in a dataset when the values are arranged in ascending or descending order. If there’s an even number of values, the median is the average of the two middle values. The median is less sensitive to outliers than the mean.
- Mode: The mode is the value that appears most frequently in a dataset. A dataset can have one mode (unimodal), more than one mode (bimodal or multimodal), or no mode if all values appear with the same frequency.
2. Why are Mean, Median, and Mode Important?
Understanding mean, median, and mode is crucial for several reasons:
- Data Analysis: They provide insights into the distribution and central tendency of data.
- Decision Making: They help in making informed decisions based on data.
- Identifying Trends: They assist in identifying patterns and trends within data.
- Comparing Datasets: They allow for comparison of different datasets.
- Statistical Inference: They are fundamental to more advanced statistical analyses.
For instance, in business, understanding the mean, median, and mode of sales data can help in inventory management and forecasting. In healthcare, these measures can be used to analyze patient data and identify trends in health outcomes.
3. How to Calculate the Mean
The mean is calculated by adding up all the values in a dataset and dividing by the number of values. Here’s a step-by-step guide:
- Sum all the data values: Add all the numbers in your dataset together.
- Count the number of values: Determine how many numbers are in your dataset.
- Divide the sum by the count: Divide the sum of the values by the number of values.
3.1. Mean Formula
The formula for calculating the mean (x̄) of a dataset is:
[ text{mean} = overline{x} = dfrac{sum_{i=1}^{n}x_i}{n} ]
Where:
- x̄ is the mean
- ∑ (sigma) represents the sum of all values
- xᵢ represents each individual value in the dataset
- n is the number of values in the dataset
3.2. Example of Calculating the Mean
Let’s say we have the following dataset: 4, 8, 6, 5, 3
- Sum the values: 4 + 8 + 6 + 5 + 3 = 26
- Count the values: There are 5 values in the dataset.
- Divide the sum by the count: 26 / 5 = 5.2
Therefore, the mean of this dataset is 5.2.
4. How to Find the Median
The median is the middle value in a dataset when the values are arranged in ascending or descending order. Here’s how to find it:
- Arrange the data: Sort the data values from lowest to highest.
- Identify the middle value:
- If there’s an odd number of values, the median is the middle value.
- If there’s an even number of values, the median is the average of the two middle values.
4.1. Median Example (Odd Number of Values)
For the dataset: 1, 3, 6, 7, 10
- Arrange the data: 1, 3, 6, 7, 10
- Identify the middle value: The middle value is 6.
Therefore, the median of this dataset is 6.
4.2. Median Example (Even Number of Values)
For the dataset: 1, 3, 6, 7, 10, 12
- Arrange the data: 1, 3, 6, 7, 10, 12
- Identify the middle values: The two middle values are 6 and 7.
- Calculate the average of the middle values: (6 + 7) / 2 = 6.5
Therefore, the median of this dataset is 6.5.
4.3. Median Formula
To formally define the median, consider a dataset x1 ≤ x2 ≤ x3 ≤ … ≤ xn arranged from lowest to highest value. The median (( widetilde{x} )) is the data point separating the upper half of the data values from the lower half.
If the size of the data set n is odd, the median is the value at position p where
[ p = dfrac{n + 1}{2} ]
[ widetilde{x} = x_p ]
If n is even, the median is the average of the values at positions p and p + 1 where
[ p = dfrac{n}{2} ]
[ widetilde{x} = dfrac{x{p} + x{p+1}}{2} ]
5. How to Find the Mode
The mode is the value or values in the dataset that occur most frequently. Here’s how to find it:
- Count the frequency of each value: Determine how many times each value appears in the dataset.
- Identify the value(s) with the highest frequency: The value(s) that appear most often is/are the mode(s).
5.1. Mode Example
For the dataset: 2, 3, 3, 4, 5, 5, 5, 6
- Count the frequency of each value:
- 2 appears 1 time
- 3 appears 2 times
- 4 appears 1 time
- 5 appears 3 times
- 6 appears 1 time
- Identify the value(s) with the highest frequency: The value 5 appears most often (3 times).
Therefore, the mode of this dataset is 5.
5.2. Datasets with Multiple Modes
A dataset can have more than one mode:
- Bimodal: A dataset with two modes.
- Multimodal: A dataset with more than two modes.
For example, in the dataset 2, 2, 3, 4, 5, 5, the modes are 2 and 5 because they both appear twice.
5.3. Datasets with No Mode
If all values in a dataset appear with the same frequency, the dataset has no mode. For example, in the dataset 1, 2, 3, 4, 5, there is no mode.
6. Mean vs. Median vs. Mode: Key Differences
| Feature | Mean | Median | Mode |
|---|---|---|---|
| Definition | The average of all values in a dataset. | The middle value in a dataset when the values are arranged in ascending or descending order. | The value that appears most frequently in a dataset. |
| Calculation | Sum of all values divided by the number of values. | Middle value (odd number of values) or average of the two middle values (even number of values). | Count the frequency of each value and identify the most frequent one(s). |
| Sensitivity to Outliers | Highly sensitive; outliers can significantly affect the mean. | Less sensitive; outliers have minimal impact on the median. | Not affected by outliers. |
| Use Cases | Useful when the data is normally distributed and there are no significant outliers. | Useful when the data is skewed or contains outliers. | Useful for identifying the most common value(s) in a dataset. |
| Example | For the dataset 2, 4, 6, 8, 10, the mean is (2+4+6+8+10)/5 = 6. | For the dataset 2, 4, 6, 8, 10, the median is 6. | For the dataset 2, 4, 6, 6, 8, 10, the mode is 6. |
| Advantages | Easy to calculate and understand; uses all values in the dataset. | Provides a measure of central tendency that is not influenced by extreme values. | Identifies the most common value(s); useful for categorical data. |
| Disadvantages | Can be distorted by outliers; may not be representative of the dataset if it’s skewed. | Does not use all values in the dataset; may not be representative of the dataset if it’s highly variable. | May not exist or may not be unique; not useful if all values are different. |
7. Real-World Applications of Mean, Median, and Mode
Mean, median, and mode are used in various fields to analyze data and make informed decisions. Here are some examples:
- Economics: Economists use mean, median, and mode to analyze income distribution, inflation rates, and unemployment statistics. For example, the median income is often used to represent the typical income of a household, as it is less affected by extremely high or low incomes.
- Healthcare: Healthcare professionals use these measures to analyze patient data, such as blood pressure, cholesterol levels, and body temperature. The mean body temperature of a population can help identify potential health issues.
- Education: Educators use mean, median, and mode to analyze student test scores, attendance rates, and graduation rates. The mean test score can provide an overall measure of student performance, while the median score can indicate the middle performance level.
- Marketing: Marketers use mean, median, and mode to analyze customer demographics, purchase behavior, and website traffic. The mode can help identify the most popular product or service among customers.
- Sports: Coaches and analysts use mean, median, and mode to analyze player statistics, team performance, and game outcomes. The mean number of points scored by a player can provide a measure of their offensive contribution.
- Environmental Science: Scientists use mean, median, and mode to analyze environmental data, such as air quality, water quality, and temperature variations. The mean temperature over a period can help track climate change.
- Quality Control: Manufacturers use mean, median, and mode to monitor product quality, identify defects, and ensure consistency in production processes. The mean weight of a product can be used to ensure it meets specifications.
- Finance: Financial analysts use mean, median, and mode to analyze stock prices, investment returns, and market trends. The mean return on investment can provide an overall measure of investment performance.
These examples illustrate the diverse applications of mean, median, and mode across various fields, highlighting their importance in data analysis and decision-making.
8. Common Mistakes to Avoid When Calculating Mean, Median, and Mode
Calculating mean, median, and mode accurately requires attention to detail. Here are some common mistakes to avoid:
- Incorrectly Summing Values: Double-check your addition when calculating the mean to ensure accuracy.
- Forgetting to Sort Data for Median: Always sort the data from lowest to highest before finding the median.
- Misidentifying the Middle Value: When finding the median with an even number of values, remember to average the two middle values.
- Confusing Mean, Median, and Mode: Understand the differences between these measures and use the appropriate one for your analysis.
- Ignoring Outliers: Be aware of outliers and their potential impact on the mean. Consider using the median if outliers are present.
- Incorrectly Counting Frequency for Mode: Ensure you accurately count the frequency of each value when finding the mode.
- Not Checking for Multiple Modes: Remember that a dataset can have multiple modes or no mode at all.
- Using the Wrong Formula: Use the correct formula for calculating the mean and median, especially when dealing with grouped data.
- Rounding Errors: Avoid rounding errors by keeping enough decimal places during calculations.
- Misinterpreting Results: Understand the context of your data and interpret the results of your calculations correctly.
By avoiding these common mistakes, you can ensure the accuracy of your calculations and the validity of your data analysis.
9. Advanced Concepts Related to Mean, Median, and Mode
While mean, median, and mode are fundamental concepts, they are also related to more advanced statistical concepts. Here are some of them:
- Weighted Mean: A weighted mean is used when some values in a dataset are more important than others. Each value is assigned a weight, and the weighted mean is calculated by multiplying each value by its weight, summing the results, and dividing by the sum of the weights.
- Geometric Mean: The geometric mean is used to find the average rate of change over time. It is calculated by multiplying all the values in a dataset and taking the nth root, where n is the number of values.
- Harmonic Mean: The harmonic mean is used to find the average rate when the values are rates or ratios. It is calculated by dividing the number of values by the sum of the reciprocals of the values.
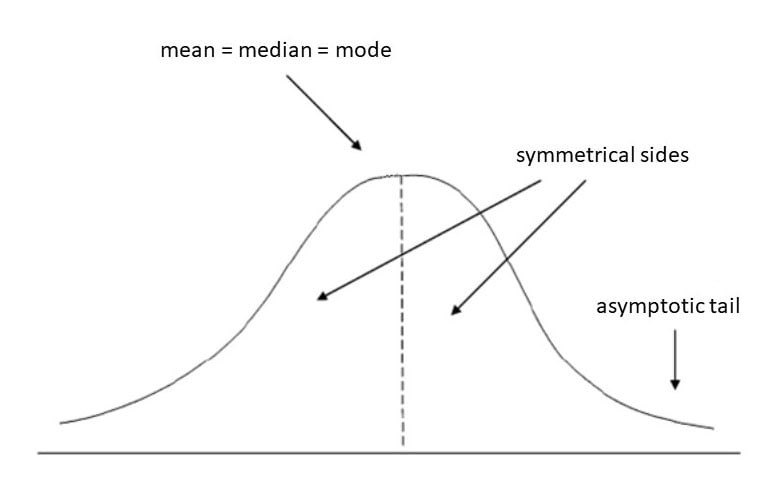
- Skewness: Skewness is a measure of the asymmetry of a distribution. A distribution can be positively skewed (right-skewed) or negatively skewed (left-skewed). The mean is affected by skewness, while the median is not.
- Kurtosis: Kurtosis is a measure of the “tailedness” of a distribution. A distribution can be leptokurtic (heavy-tailed) or platykurtic (light-tailed). Kurtosis affects the interpretation of statistical measures such as the standard deviation.
- Percentiles: Percentiles are values that divide a dataset into 100 equal parts. The median is the 50th percentile. Percentiles are used to describe the relative position of a value in a dataset.
- Quartiles: Quartiles are values that divide a dataset into four equal parts. The first quartile (Q1) is the 25th percentile, the second quartile (Q2) is the 50th percentile (median), and the third quartile (Q3) is the 75th percentile.
 statistical analysis
10. Frequently Asked Questions (FAQs) about Mean, Median, and Mode
| Question | Answer |
|---|---|
| What is the difference between mean and average? | Mean and average are often used interchangeably, but in statistics, mean refers to the sum of values divided by the number of values, while average can refer to any measure of central tendency. |
| When should I use the median instead of the mean? | Use the median when the data is skewed or contains outliers, as the median is less affected by extreme values than the mean. |
| Can a dataset have more than one mode? | Yes, a dataset can have more than one mode (bimodal or multimodal) if multiple values appear with the same highest frequency. |
| What does it mean if a dataset has no mode? | If all values in a dataset appear with the same frequency, the dataset has no mode. |
| How do I calculate the weighted mean? | To calculate the weighted mean, multiply each value by its weight, sum the results, and divide by the sum of the weights. |
| What is the relationship between mean and skewness? | The mean is affected by skewness, while the median is not. In a positively skewed distribution, the mean is typically greater than the median, and in a negatively skewed distribution, the mean is typically less than the median. |
| How are percentiles related to the median? | The median is the 50th percentile, which means that 50% of the values in the dataset are below the median and 50% are above it. |
| What are quartiles and how are they calculated? | Quartiles are values that divide a dataset into four equal parts. The first quartile (Q1) is the 25th percentile, the second quartile (Q2) is the 50th percentile (median), and the third quartile (Q3) is the 75th percentile. |
| How do I identify outliers in a dataset? | Outliers can be identified using various methods, such as the interquartile range (IQR) method or the z-score method. |
| Can mean, median, and mode be used for categorical data? | While mean and median are typically used for numerical data, the mode can be used for categorical data to identify the most common category. |
11. Formulas for Mean, Median, and Mode
| Measure | Formula | Description |
|---|---|---|
| Mean | [ text{mean} = overline{x} = dfrac{sum_{i=1}^{n}x_i}{n} ] | The sum of all values in a dataset divided by the number of values. |
| Median | If n is odd: [ widetilde{x} = xp ] where [ p = dfrac{n + 1}{2} ] If n is even: [ widetilde{x} = dfrac{x{p} + x_{p+1}}{2} ] where [ p = dfrac{n}{2} ] |
The middle value in a dataset when the values are arranged in ascending or descending order. |
| Mode | Identify the value(s) that appear most frequently in the dataset. | The value or values in a dataset that occur most frequently. |
| IQR | IQR = Q3 – Q1 | The difference between the third quartile (Q3) and the first quartile (Q1), representing the range of the middle 50% of the data. |
| Outliers | Upper Fence = Q3 + 1.5 × IQR Lower Fence = Q1 − 1.5 × IQR |
Potential outliers are values that lie above the Upper Fence or below the Lower Fence of the sample set. |
Understanding and applying these formulas will help you accurately calculate and interpret mean, median, and mode in various statistical analyses.
12. Resources for Further Learning
To deepen your understanding of mean, median, and mode, here are some valuable resources:
- Khan Academy: Offers free video lessons and practice exercises on statistics, including mean, median, and mode.
- StatTrek: Provides clear explanations and examples of statistical concepts, including measures of central tendency.
- Statistics How To: Offers articles and tutorials on various statistical topics, including mean, median, and mode.
- OpenIntro: Provides free and open-source textbooks on statistics, covering mean, median, and mode in detail.
- Coursera and edX: Offer online courses on statistics from top universities, covering advanced concepts related to mean, median, and mode.
- Textbooks: Refer to introductory statistics textbooks for comprehensive explanations and examples.
- Online Calculators: Use online calculators to practice calculating mean, median, and mode for different datasets.
13. Use Cases by Profession
The measures of Mean, Median, and Mode are used ubiquitously across various professions. Here are some examples of where these measures are helpful:
| Profession | Application of Mean, Median, and Mode |
|---|---|
| Teachers | Teachers use Mean, Median, and Mode to understand class grades. The mean is used to get the average score of the class. Median is used to see the middle grade so you can see how students are performing compared to their peers. Mode is used to understand which scores are most common, which could tell a teacher what topics the students may need more help with. |
| Real Estate | Mean is used to find the average price of homes in an area. Median is used to find the middle ground of home prices, and to better understand home values without extremely high value homes skewing the average. Mode is used to determine the most common home price in an area. |
| Restaurant Owners | Mean is used to understand the average amount customers spend per meal. Median is used to understand the middle spend so you can see how many people are spending above or below your average price. Mode is used to understand what dish is most commonly ordered, which could help with supply chain and marketing efforts. |
| Medical Field | Mean is used to understand a patients average heart rate. Median is used to determine the middle ground for peoples heart rates so doctors can understand if a patients heart rate is unusually high. Mode is used to understand common blood pressure readings, which can help with understanding a common illness. |
14. Conclusion: Mastering Mean, Median, and Mode
Understanding mean, median, and mode is essential for anyone working with data. These measures provide valuable insights into the central tendency of a dataset and are used in various fields to make informed decisions. By mastering these concepts, you can enhance your data analysis skills and gain a deeper understanding of the world around you. Remember, WHAT.EDU.VN is here to support your learning journey with clear explanations and helpful resources.
15. Still Have Questions? Ask on WHAT.EDU.VN for Free!
Are you still struggling with mean, median, or mode? Do you have more questions about data analysis or statistics? Don’t worry! WHAT.EDU.VN is here to help. We offer a free question-and-answer platform where you can ask any question and get expert answers from our community of knowledgeable users.
Why Use WHAT.EDU.VN?
- Free: It’s completely free to ask and receive answers.
- Fast: Get answers quickly from a community of experts.
- Easy: Our platform is user-friendly and easy to navigate.
- Comprehensive: Get answers to any question, no matter how simple or complex.
- Community-Driven: Learn from a community of knowledgeable users.
How to Ask a Question on WHAT.EDU.VN
- Visit our website: WHAT.EDU.VN
- Create a free account or log in.
- Go to the “Ask a Question” section.
- Type your question clearly and concisely.
- Select the appropriate category for your question.
- Submit your question and wait for answers from our community.
Don’t hesitate to ask! Our community is ready to help you with any questions you have.
Contact Us:
- Address: 888 Question City Plaza, Seattle, WA 98101, United States
- Whatsapp: +1 (206) 555-7890
- Website: what.edu.vn
We’re here to help you learn and grow. Ask your questions today and get the answers you need!