Answering the question “What Is Margin Of Error” can significantly improve the accuracy and reliability of your statistical findings, as explained by WHAT.EDU.VN. This crucial statistical concept helps quantify the uncertainty in survey results and data analysis. Understanding margin of error, confidence interval, and sample size ensures more informed decisions.
Table of Contents
-
What Is Margin of Error?
-
Why Is Margin of Error Important?
-
How to Calculate Margin of Error
3.1. Formula for Population Proportion
3.2. Formula for Sample Mean
-
Factors Affecting Margin of Error
4.1. Sample Size
4.2. Population Standard Deviation
4.3. Confidence Level
-
Margin of Error vs. Confidence Interval
-
Margin of Error vs. Standard Error
-
Acceptable Margin of Error: What Is Considered Good?
-
How to Reduce Margin of Error
-
Real-World Examples of Margin of Error
9.1. Political Polls
9.2. Market Research
9.3. Scientific Studies
-
Limitations of Margin of Error
-
Margin of Error: Common Mistakes to Avoid
-
The Future of Margin of Error in Data Analysis
-
FAQ: Understanding Margin of Error
13.1. What does a margin of error of ±5% mean?
13.2. How does sample size affect margin of error?
13.3. Can margin of error be zero?
13.4. Is a smaller margin of error always better?
13.5. How does confidence level impact margin of error?
13.6. What is the relationship between margin of error and statistical significance?
13.7. What are the ethical considerations regarding the use of margin of error?
13.8. How is margin of error used in A/B testing?
13.9. Can margin of error be used for qualitative research?
13.10. How does non-response bias affect margin of error?
-
Conclusion
1. What Is Margin of Error?
Margin of error is a statistical measure that quantifies the amount of random sampling error in a survey’s results. It is the range within which the true population value is likely to fall. Expressed as a plus or minus percentage, for example ±3%, it indicates the potential difference between the sample estimate and the actual population value. A smaller margin of error suggests the survey results are more precise, while a larger one indicates greater uncertainty. Understanding the implications of margin of error is essential for accurately interpreting and applying statistical findings.
In essence, the margin of error is your “buffer zone” of uncertainty. It helps you understand how much the results from your sample might differ from the actual values in the entire population. Grasping related terms like confidence level, confidence interval, and standard deviation will empower you to make sense of the data you encounter.
2. Why Is Margin of Error Important?
The margin of error is crucial because it provides a clear understanding of the reliability and accuracy of survey results and statistical data. Without it, conclusions drawn from data can be misleading and inaccurate. Here’s why it matters:
- Provides Context for Data Interpretation: It helps in understanding the range within which the true population value likely falls.
- Aids in Decision-Making: By understanding the uncertainty, better-informed decisions can be made in fields like marketing, politics, and research.
- Enhances Credibility: Reporting the margin of error adds transparency and credibility to the research, showing awareness of potential variability.
- Prevents Misinterpretation: It reduces the risk of overstating the precision of survey results, preventing flawed conclusions.
- Supports Sample Size Determination: It helps in deciding the necessary sample size for a desired level of accuracy.
- Facilitates Comparison: Allows for meaningful comparisons between different surveys or studies by accounting for potential variations.
- Highlights Limitations: It clearly indicates the limitations of the data, reminding users that results are estimates, not exact figures.
For example, according to a study by the Pew Research Center in 2023, reporting the margin of error in political polls helps the public better understand the potential range of voter support for a candidate. Without this context, minor differences in poll results might be misinterpreted as significant shifts in voter preference.
3. How to Calculate Margin of Error
Calculating the margin of error involves using statistical formulas that take into account the sample size, population standard deviation, and desired confidence level. The formula varies slightly depending on whether you are dealing with population proportions or sample means. Here are the two main formulas:
3.1. Formula for Population Proportion
When you’re estimating the proportion of a population that has a certain characteristic, you use this formula:
Margin of Error = z * √((p * (1 - p)) / n)Where:
z= z-score corresponding to the desired confidence level (e.g., 1.96 for 95% confidence)p= sample proportion (the estimated proportion of the characteristic in the sample)n= sample size
For example, if you survey 500 people (n = 500) and find that 60% (p = 0.6) support a certain policy with a 95% confidence level (z = 1.96), the margin of error would be:
Margin of Error = 1.96 * √((0.6 * (1 - 0.6)) / 500) ≈ 0.043 or 4.3%Alt Text: Margin of Error Formula for Population Proportion: Margin of Error equals z-score times the square root of (p times (1 minus p)) divided by n.
3.2. Formula for Sample Mean
When you are estimating the average value of a continuous variable, you use this formula:
Margin of Error = t * (s / √n)Where:
t= t-score corresponding to the desired confidence level and degrees of freedom (n-1)s= sample standard deviationn= sample size
For example, if you measure the test scores of 30 students (n = 30) and find the sample standard deviation is 10 (s = 10) with a 95% confidence level (t ≈ 2.045 for 29 degrees of freedom), the margin of error would be:
Margin of Error = 2.045 * (10 / √30) ≈ 3.74This means the true average test score of the entire student population is likely to be within 3.74 points of the sample mean.
Understanding these formulas allows you to calculate the margin of error for different types of data and make more informed interpretations of your results.
4. Factors Affecting Margin of Error
Several factors influence the margin of error in statistical studies. The main factors include sample size, population standard deviation, and confidence level. Understanding these elements is crucial for accurately interpreting and minimizing the margin of error in your research.
4.1. Sample Size
The sample size is the number of individuals or observations included in the study. A larger sample size generally leads to a smaller margin of error because it provides a more accurate representation of the population. As the sample size increases, the sampling error decreases, which in turn reduces the margin of error.
- Larger Sample Size: Smaller margin of error, more precise results.
- Smaller Sample Size: Larger margin of error, less precise results.
For example, surveying 1,000 people will typically yield a smaller margin of error than surveying 100 people, assuming all other factors are constant.
4.2. Population Standard Deviation
The population standard deviation measures the variability or spread of data points in a population. A higher standard deviation indicates greater variability, which increases the margin of error. Conversely, a lower standard deviation indicates less variability and a smaller margin of error.
- Higher Standard Deviation: Larger margin of error, more variability.
- Lower Standard Deviation: Smaller margin of error, less variability.
If you’re measuring income in a population where some individuals earn significantly more or less than the average, the high standard deviation will result in a larger margin of error.
4.3. Confidence Level
The confidence level indicates the probability that the true population value falls within the specified margin of error. Common confidence levels are 90%, 95%, and 99%. A higher confidence level requires a wider margin of error to ensure greater certainty that the true value is captured.
- Higher Confidence Level: Larger margin of error, greater certainty.
- Lower Confidence Level: Smaller margin of error, less certainty.
For instance, a 99% confidence level will result in a larger margin of error compared to a 90% confidence level, assuming all other factors remain the same.
Understanding how these factors interact is essential for designing effective studies and interpreting results accurately.
5. Margin of Error vs. Confidence Interval
Margin of error and confidence interval are related but distinct concepts in statistics. The margin of error is a specific value that quantifies the uncertainty around a sample estimate, while the confidence interval is the range within which the true population value is likely to fall. Here’s a breakdown:
- Margin of Error: This is the plus or minus value (e.g., ±3%) that indicates the potential difference between the sample statistic and the true population parameter.
- Confidence Interval: This is the range calculated by adding and subtracting the margin of error from the sample statistic. It provides a range of plausible values for the population parameter.
For example, if a survey finds that 60% of respondents support a policy with a margin of error of ±3%, the confidence interval would be 57% to 63%. This means we can be confident that the true percentage of the population that supports the policy lies between 57% and 63%.
The confidence level (e.g., 95%) associated with the confidence interval indicates the probability that the interval contains the true population parameter. In other words, if we were to repeat the survey multiple times, 95% of the resulting confidence intervals would contain the true population value.
Understanding the relationship between margin of error and confidence interval is crucial for interpreting statistical results accurately. The margin of error provides a measure of uncertainty, while the confidence interval provides a range of plausible values for the population parameter.
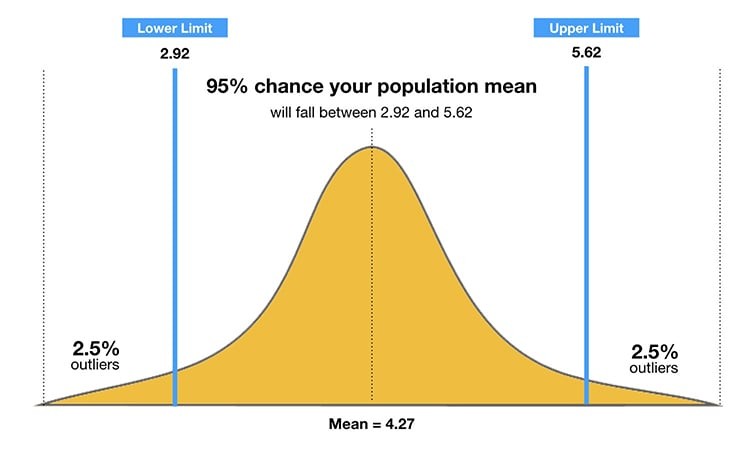 Confidence Interval
Alt Text: Confidence Interval: A visual representation showing the sample mean, margin of error, and the resulting confidence interval.
6. Margin of Error vs. Standard Error
Margin of error and standard error are both measures of statistical variability, but they serve different purposes. Understanding their distinctions is crucial for accurate data interpretation.
- Standard Error (SE): This estimates the variability of sample means around the population mean. It measures how much sample means vary from each other.
- Margin of Error (ME): This quantifies the uncertainty in a specific estimate from a sample. It uses the standard error to determine the range within which the true population value likely falls.
Here’s a table summarizing the key differences:
| Feature | Standard Error | Margin of Error |
|---|---|---|
| Definition | Variability of sample means | Uncertainty in a specific estimate |
| Purpose | Measures sample variability | Determines the range for the true population value |
| Calculation | SE = σ / √n (where σ is population standard deviation, n is sample size) | ME = z * SE (where z is the z-score for the desired confidence level) |
| Use | Used in hypothesis testing and confidence intervals | Used to interpret the accuracy of survey results |
| Focus | Variability of sampling distribution | Accuracy of a single sample estimate |
| Interpretation | How much sample means vary | How much the sample estimate might differ from the true value |
In essence, the standard error is a building block for calculating the margin of error. The margin of error takes the standard error and incorporates a confidence level to provide a range within which the true population value is likely to reside.
According to a 2022 report by the American Statistical Association, understanding the distinction between standard error and margin of error helps researchers avoid misinterpreting the precision of their estimates. Using the correct measure ensures that conclusions drawn from the data are well-founded and accurate.
7. Acceptable Margin of Error: What Is Considered Good?
Determining what constitutes an acceptable margin of error depends on the context of the study, the importance of the decisions based on the results, and the resources available. There is no one-size-fits-all answer, but some general guidelines can help.
- ±1% to ±3%: This is typically considered excellent and provides a high degree of precision. It is often used in critical studies where accuracy is paramount, such as medical research or high-stakes political polls.
- ±4% to ±5%: This is generally acceptable for many types of research, including market research, academic surveys, and policy analysis. It provides a good balance between precision and practicality.
- ±6% to ±10%: This may be acceptable for exploratory studies or situations where resources are limited. However, results should be interpreted with caution, and decisions should account for the higher level of uncertainty.
- Over ±10%: This is usually considered too high for most applications, as the level of uncertainty is significant. It is often insufficient for making informed decisions.
Here’s a table illustrating these guidelines:
| Margin of Error | Acceptability | Use Cases |
|---|---|---|
| ±1% to ±3% | Excellent | Medical research, high-stakes political polls |
| ±4% to ±5% | Acceptable | Market research, academic surveys, policy analysis |
| ±6% to ±10% | Questionable | Exploratory studies, limited resource situations |
| Over ±10% | Unacceptable | Generally insufficient for making informed decisions |
For example, if a market research firm is deciding whether to launch a new product, they might aim for a margin of error of ±4% to ensure they have a reasonably accurate understanding of consumer preferences. In contrast, a small local survey with limited resources might accept a margin of error of ±7%, recognizing the trade-off between precision and feasibility.
Ultimately, the acceptable margin of error should be determined by weighing the costs of uncertainty against the costs of increasing sample size or improving data collection methods.
8. How to Reduce Margin of Error
Reducing the margin of error improves the precision and reliability of your study results. Here are several effective strategies to minimize the margin of error:
- Increase Sample Size: This is the most direct way to reduce the margin of error. A larger sample provides a more accurate representation of the population.
- Reduce Variability: Minimize variability in your data by using consistent measurement techniques and clearly defined criteria.
- Use Stratified Sampling: Divide the population into subgroups (strata) and sample proportionally from each. This ensures representation from all segments and can reduce sampling error.
- Improve Measurement Accuracy: Ensure that your measurement tools and methods are accurate and reliable to minimize errors in data collection.
- Increase Confidence Level Strategically: While a higher confidence level increases the margin of error, consider if the added certainty is necessary for your specific goals.
- Use Finite Population Correction: If your sample size is a significant proportion of the total population, apply a finite population correction factor to reduce the margin of error.
Here’s a table summarizing these strategies:
| Strategy | Description | Impact on Margin of Error |
|---|---|---|
| Increase Sample Size | Survey more individuals or observations | Decreases |
| Reduce Variability | Use consistent measurement techniques and clear criteria | Decreases |
| Use Stratified Sampling | Divide the population into subgroups and sample proportionally | Decreases |
| Improve Measurement Accuracy | Ensure accurate and reliable measurement tools and methods | Decreases |
| Increase Confidence Level | Use a higher confidence level (e.g., 99% instead of 95%) | Increases |
| Finite Population Correction | Apply correction factor when the sample size is a significant proportion of the total population | Decreases |
For example, if you are conducting a customer satisfaction survey, increasing the number of respondents from 200 to 500 can significantly reduce the margin of error. Additionally, ensuring that the survey questions are clear and unbiased will reduce variability in the responses.
By systematically implementing these strategies, you can reduce the margin of error and increase the confidence in your study results.
9. Real-World Examples of Margin of Error
The margin of error plays a crucial role in interpreting data across various fields, from political polls to market research and scientific studies. Here are some real-world examples:
9.1. Political Polls
In political polling, the margin of error indicates the range within which the true level of support for a candidate or issue likely falls. For example, if a poll reports that 55% of voters support a candidate with a margin of error of ±3%, the actual support could be anywhere between 52% and 58%. This is vital for understanding the closeness of a race and whether differences between candidates are statistically significant.
According to a 2024 analysis by FiveThirtyEight, understanding the margin of error in political polls helps to temper expectations and avoid overreacting to small changes in poll numbers. It provides a more realistic view of the uncertainty inherent in survey results.
9.2. Market Research
Market research uses the margin of error to assess the accuracy of consumer surveys. For instance, if a company finds that 70% of consumers prefer a new product with a margin of error of ±5%, they can be reasonably confident that the true preference level lies between 65% and 75%. This information is crucial for making informed decisions about product development, marketing strategies, and inventory management.
A 2023 study by the Marketing Research Association emphasized that reporting the margin of error in market research enhances the credibility of the findings and ensures that business decisions are based on a clear understanding of the data’s limitations.
9.3. Scientific Studies
In scientific research, the margin of error helps to evaluate the reliability of experimental results. For example, if a study finds that a new drug is effective in 80% of patients with a margin of error of ±4%, it means the true effectiveness rate could be between 76% and 84%. This is critical for determining whether the drug is truly effective and whether the results are statistically significant.
According to guidelines from the National Institutes of Health (NIH), researchers are encouraged to report the margin of error or confidence intervals to provide a clear indication of the uncertainty associated with their findings. This promotes transparency and helps other researchers assess the validity of the results.
These examples illustrate how understanding the margin of error is essential for interpreting data accurately and making informed decisions across various domains.
Alt Text: A visual of a political poll indicating voter preferences, highlighting the importance of margin of error in interpreting the results.
10. Limitations of Margin of Error
While the margin of error is a valuable tool for assessing the accuracy of statistical estimates, it has several limitations that users should be aware of:
- Only Accounts for Random Sampling Error: The margin of error only quantifies the uncertainty due to random sampling. It does not account for other sources of error, such as non-response bias, measurement errors, or selection bias.
- Assumes Simple Random Sampling: The standard formulas for calculating the margin of error assume that the data were collected using simple random sampling. If other sampling methods are used (e.g., stratified sampling, cluster sampling), the margin of error may need to be adjusted.
- Dependent on Sample Size: The margin of error decreases as the sample size increases, but there are diminishing returns. Increasing the sample size from 100 to 200 will have a greater impact on the margin of error than increasing it from 1000 to 1100.
- Affected by Population Variability: The margin of error is influenced by the variability in the population. If the population is highly heterogeneous, the margin of error will be larger than if the population is homogeneous.
- May Be Misinterpreted: The margin of error is often misinterpreted as the maximum possible error or as a guarantee of accuracy. It is simply a range within which the true population value is likely to fall, with a certain level of confidence.
- Not Applicable to All Studies: The margin of error is most applicable to studies that involve estimating population parameters, such as proportions or means. It may not be relevant for exploratory studies or qualitative research.
- Assumes Normal Distribution: Many margin of error calculations assume that the sample data follow a normal distribution. If the data are highly skewed or non-normal, the margin of error may be inaccurate.
According to a 2023 report by the National Research Council, understanding the limitations of the margin of error is crucial for avoiding overconfidence in statistical estimates and for recognizing the potential for other sources of error to influence the results.
11. Margin of Error: Common Mistakes to Avoid
Understanding margin of error is essential, but it’s equally important to avoid common mistakes that can lead to misinterpretations and flawed conclusions. Here are some frequent pitfalls:
- Ignoring Non-Sampling Errors: The margin of error only accounts for random sampling errors. Overlooking non-sampling errors like response bias, measurement errors, and selection bias can lead to an overestimation of accuracy.
- Assuming Applicability to All Studies: The margin of error is primarily relevant for studies aiming to estimate population parameters (e.g., proportions, means). Applying it to exploratory or qualitative research can be misleading.
- Misinterpreting the Meaning: The margin of error is often misunderstood as the maximum possible error. It actually indicates a range within which the true population value is likely to fall, given a specific confidence level.
- Using Incorrect Formulas: Applying the wrong formula, such as using a z-score when a t-score is more appropriate, can result in an inaccurate margin of error.
- Not Considering the Context: Failing to consider the context of the study, including the importance of the decisions based on the results, can lead to an inappropriate interpretation of the margin of error.
- Over-Reliance on Small Samples: Relying on results from small samples, even with a seemingly acceptable margin of error, can be risky. Small samples are more susceptible to random variation.
- Neglecting Stratification: In stratified sampling, failing to account for the stratification in the margin of error calculation can lead to an inaccurate estimate of the overall uncertainty.
- Assuming Normality: Many margin of error calculations assume that the sample data follow a normal distribution. If the data are significantly non-normal, this assumption can be invalid.
A 2022 analysis by the American Statistical Association highlighted that avoiding these common mistakes is crucial for ensuring that statistical results are interpreted correctly and that decisions are based on a clear understanding of the data’s limitations.
12. The Future of Margin of Error in Data Analysis
As data analysis continues to evolve, the role of the margin of error is also adapting to meet new challenges and opportunities. Here are some key trends shaping the future of margin of error in data analysis:
- Integration with Big Data: With the rise of big data, traditional methods of calculating the margin of error may not always be applicable. New techniques are being developed to account for the complexities of large datasets, including issues of data quality, representativeness, and computational feasibility.
- Advanced Statistical Methods: More sophisticated statistical methods, such as Bayesian analysis and machine learning, are being used to provide more nuanced estimates of uncertainty. These methods can incorporate prior knowledge and handle complex data structures, leading to more accurate and reliable results.
- Emphasis on Transparency and Reproducibility: There is a growing emphasis on transparency and reproducibility in data analysis. This includes clearly reporting the margin of error and other measures of uncertainty, as well as providing detailed information about the data collection and analysis methods used.
- Improved Data Visualization: Advances in data visualization are making it easier to communicate the margin of error and other statistical concepts to a wider audience. Interactive dashboards and visual tools can help users explore the uncertainty in data and make more informed decisions.
- Ethical Considerations: As data analysis becomes more pervasive, there is a growing awareness of the ethical implications of statistical results. This includes ensuring that the margin of error is not used to mislead or misrepresent the data, and that the limitations of the analysis are clearly communicated.
- Real-Time Data Analysis: The ability to analyze data in real-time is becoming increasingly important in many fields. This requires the development of methods for calculating the margin of error and other measures of uncertainty on-the-fly, as new data become available.
According to a 2024 report by the Data Science Association, the future of margin of error in data analysis will be characterized by a greater emphasis on transparency, reproducibility, and ethical considerations. By embracing these trends, data analysts can ensure that their results are accurate, reliable, and trustworthy.
13. FAQ: Understanding Margin of Error
13.1. What does a margin of error of ±5% mean?
A margin of error of ±5% means that the true population value is likely to fall within 5 percentage points above or below the sample estimate. For example, if a survey finds that 60% of respondents support a certain policy, the true percentage of the population that supports the policy is likely between 55% and 65%.
13.2. How does sample size affect margin of error?
Increasing the sample size generally reduces the margin of error because a larger sample provides a more accurate representation of the population. As the sample size increases, the sampling error decreases, which in turn reduces the margin of error.
13.3. Can margin of error be zero?
No, the margin of error cannot be zero in practical scenarios involving sampling. A zero margin of error would imply that the sample perfectly represents the entire population, which is almost impossible to achieve due to random variability.
13.4. Is a smaller margin of error always better?
Yes, a smaller margin of error generally indicates more precise and reliable results. However, reducing the margin of error often requires a larger sample size, which can be costly and time-consuming. The optimal margin of error depends on the specific goals of the study and the resources available.
13.5. How does confidence level impact margin of error?
A higher confidence level (e.g., 99% instead of 95%) requires a wider margin of error to ensure greater certainty that the true population value is captured. Conversely, a lower confidence level allows for a smaller margin of error, but with less certainty.
13.6. What is the relationship between margin of error and statistical significance?
The margin of error is related to statistical significance in that it affects the ability to detect meaningful differences between groups or variables. A smaller margin of error increases the likelihood of finding statistically significant results, while a larger margin of error makes it more difficult.
13.7. What are the ethical considerations regarding the use of margin of error?
Ethical considerations include accurately reporting the margin of error and other measures of uncertainty, avoiding the use of margin of error to mislead or misrepresent the data, and clearly communicating the limitations of the analysis.
13.8. How is margin of error used in A/B testing?
In A/B testing, the margin of error helps to determine whether observed differences between two versions of a website or application are statistically significant. It helps to assess whether the observed differences are likely due to real effects or simply due to random variation.
13.9. Can margin of error be used for qualitative research?
No, the margin of error is primarily applicable to quantitative research that involves estimating population parameters. It is not typically used in qualitative research, which focuses on exploring complex phenomena and understanding subjective experiences.
13.10. How does non-response bias affect margin of error?
Non-response bias can significantly affect the validity of survey results, but it is not accounted for by the margin of error. The margin of error only quantifies the uncertainty due to random sampling. Non-response bias can introduce systematic errors that are not captured by the margin of error.
Remember, if you have any questions about margin of error or other statistical concepts, don’t hesitate to ask the experts at WHAT.EDU.VN. We’re here to help you understand and interpret data accurately. Contact us at 888 Question City Plaza, Seattle, WA 98101, United States. You can also reach us on WhatsApp at +1 (206) 555-7890, or visit our website at WHAT.EDU.VN for more information.
14. Conclusion
Understanding what is margin of error is essential for anyone working with data, from students to professionals. It provides a crucial measure of the uncertainty in statistical estimates and helps ensure that decisions are based on accurate and reliable information. By considering factors such as sample size, confidence level, and potential sources of bias, you can minimize the margin of error and increase the confidence in your results. Armed with this knowledge, you are better equipped to interpret data, make informed decisions, and communicate your findings effectively.
Are you struggling to understand statistical concepts or need help with your data analysis? Don’t hesitate to reach out to the experts at WHAT.EDU.VN. We offer free consultations and can answer any questions you may have. Visit our website at what.edu.vn, contact us on WhatsApp at +1 (206) 555-7890, or stop by our office at 888 Question City Plaza, Seattle, WA 98101, United States. Let us help you unlock the power of data with confidence!