Every business unit relies on key performance indicators (KPIs) to monitor their progress and success. KPIs are quantifiable metrics used to evaluate the success of an organization, department, project, or individual in reaching their goals. Organizations frequently utilize KPI dashboards to visualize, review, and analyze these crucial performance metrics in a centralized view. Below, we explore various KPI examples categorized by department, offering a clearer understanding of how they are applied across different business functions.
Finance KPIs
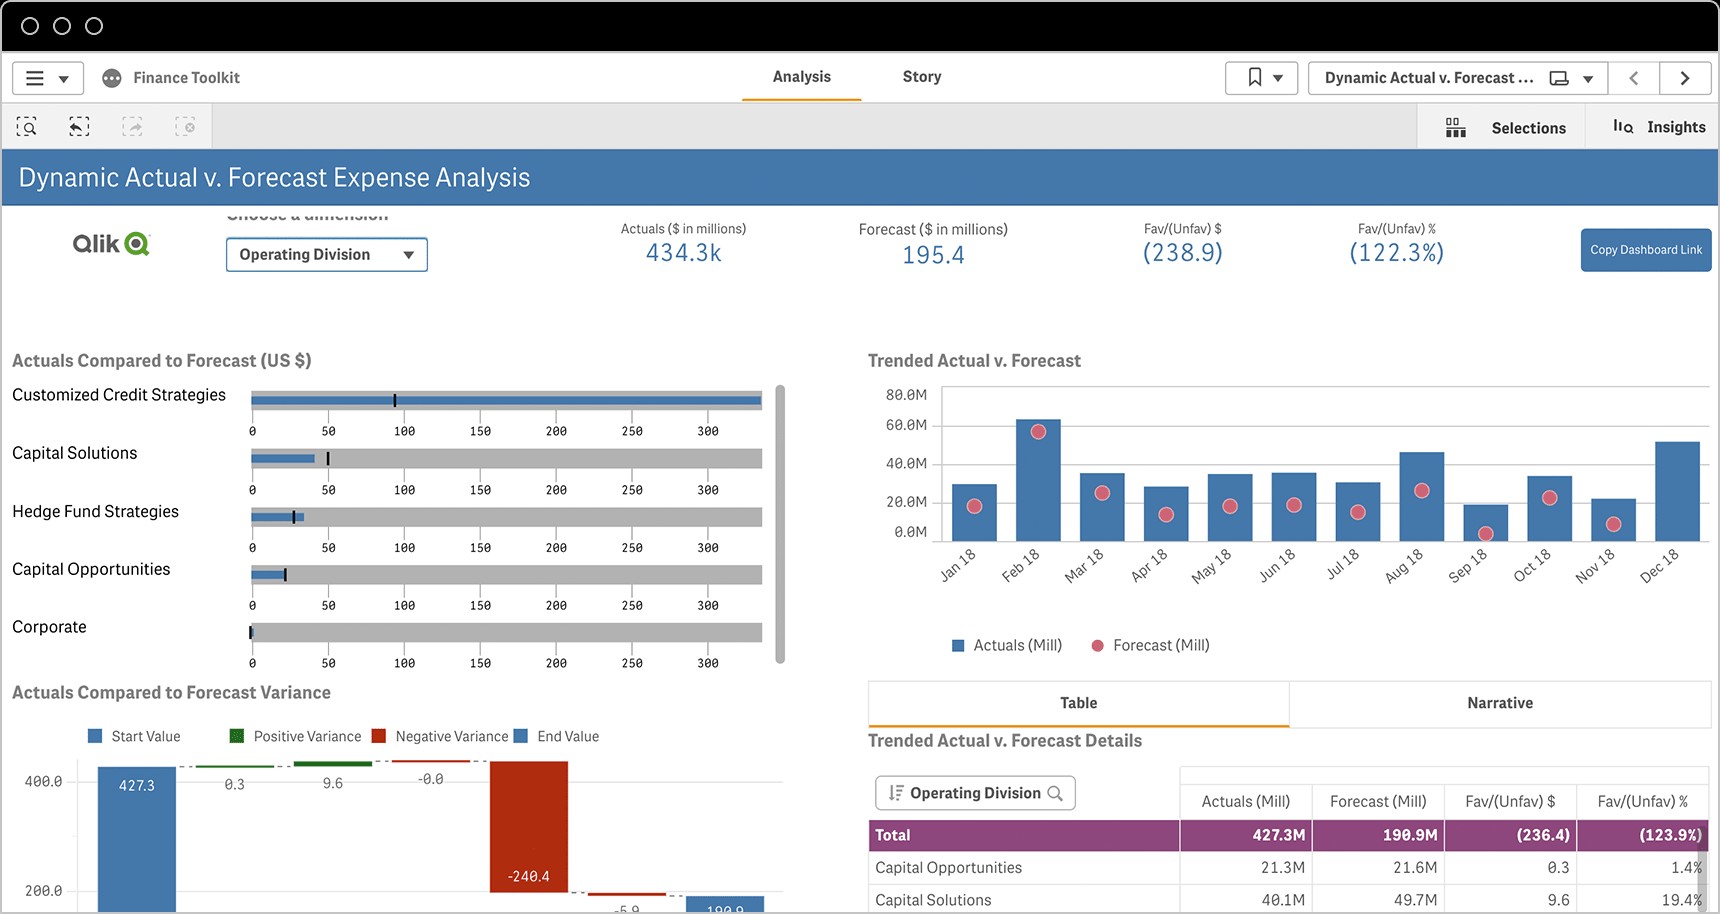
Financial KPIs are essential for tracking the economic health and stability of a company. For finance managers, monitoring these indicators is crucial for informed decision-making and strategic financial planning. Here are key examples of financial KPIs:
- Gross Profit Margin (and %): This KPI measures the percentage of revenue remaining after deducting the cost of goods sold. It indicates the profitability of a company’s core operations.
- Operating Profit Margin (and %): Operating profit margin shows the percentage of revenue left after deducting operating expenses, providing insight into a company’s profitability from its operations before interest and taxes.
- Net Profit Margin (and %): Net profit margin is the percentage of revenue remaining after all expenses, including taxes and interest, are deducted. It represents the ultimate profitability of a company.
- Operating Expense Ratio: This ratio compares operating expenses to net sales, indicating how efficiently a company is managing its overhead costs.
- Working Capital Ratio: The working capital ratio, also known as the current ratio, assesses a company’s ability to pay its short-term liabilities with its short-term assets, highlighting its liquidity.
Explore a Finance Dashboard Demo
Sales KPIs
Sales KPIs are vital for evaluating the effectiveness of sales strategies and team performance. By tracking these metrics, businesses can ensure they are on track to meet revenue targets and optimize their sales processes. Key sales KPIs include:
- New Inbound Leads: This KPI tracks the number of new leads generated through inbound marketing efforts, reflecting the success of marketing in attracting potential customers.
- New Qualified Opportunities: Qualified opportunities represent leads that have been vetted and deemed likely to convert into customers, indicating the quality of the lead pipeline.
- Total Pipeline Value: This KPI measures the total potential revenue from all qualified sales opportunities in the pipeline, providing a forecast of future sales revenue.
- Sales Volume by Location: Analyzing sales volume by geographic location helps identify strong and weak markets, allowing for targeted sales strategies.
- Average Order Value: Average order value (AOV) is the average amount spent per order, indicating customer purchasing behavior and opportunities to increase sales revenue per transaction.
Learn More About Sales Dashboards
Marketing KPIs
Marketing KPIs are crucial for measuring the impact and ROI of marketing campaigns and initiatives. By monitoring these indicators, marketing teams can optimize their strategies, improve campaign performance, and demonstrate their contribution to business goals. Important marketing KPIs are:
- Marketing Qualified Leads (MQLs): MQLs are leads that have engaged with marketing efforts and are considered more likely to become customers compared to other leads.
- Sales Qualified Leads (SQLs): SQLs are MQLs that have been further vetted by the sales team and are deemed ready for a direct sales approach.
- Conversion Rates (For Specific Goals): Conversion rates track the percentage of users completing a desired action, such as form submissions, downloads, or purchases, for specific marketing campaigns or goals.
- Social Program ROI (By Platform): This KPI measures the return on investment for social media marketing programs, broken down by platform, to evaluate the effectiveness of different social channels.
- Return on Ad Spend (ROAS): ROAS measures the revenue generated for every dollar spent on advertising, directly indicating the profitability of advertising campaigns.
Learn More About Marketing KPIs and Marketing Dashboards
IT KPIs
IT KPIs are essential for maintaining efficient and reliable technology operations within an organization. These metrics help IT departments track their performance, identify areas for improvement, and ensure alignment with business objectives. Examples of IT KPIs include:
- Total Support Tickets: This KPI tracks the overall volume of support requests received by the IT department, indicating the demand for IT support.
- Open Support Tickets: Monitoring open support tickets helps manage workload and ensures timely resolution of IT issues.
- Ticket Resolution Time: Ticket resolution time measures the average time taken to resolve support tickets, reflecting the efficiency of the IT support team.
- Security Related Downtime: This KPI tracks the duration of downtime caused by security incidents, highlighting the effectiveness of security measures and the impact of security breaches.
- IT Costs vs Revenue: Comparing IT costs to overall revenue helps assess the cost-effectiveness of IT operations and identify areas for budget optimization.
- Reopened Tickets: The number of reopened tickets indicates the quality of initial issue resolution and potential recurring problems.
Customer Service KPIs
Customer service KPIs are vital for measuring and improving the quality of customer interactions and support. These metrics help customer service leaders ensure they are meeting customer expectations, enhancing customer satisfaction, and achieving service objectives. Key customer service KPIs are:
- First Contact Resolution Rate: This KPI measures the percentage of customer issues resolved during the first interaction, indicating efficiency and customer satisfaction.
- Average Response Time: Average response time tracks the time taken for customer service to respond to inquiries, reflecting responsiveness and customer service speed.
- Most Active Support Agents: Identifying the most active support agents can highlight top performers and inform resource allocation and training needs.
- Cost Per Conversation: This KPI measures the average cost of each customer service interaction, helping optimize operational efficiency and resource management.
- Customer Effort Score: Customer Effort Score (CES) measures the ease of customer experience when interacting with customer service, directly reflecting customer satisfaction and service usability.