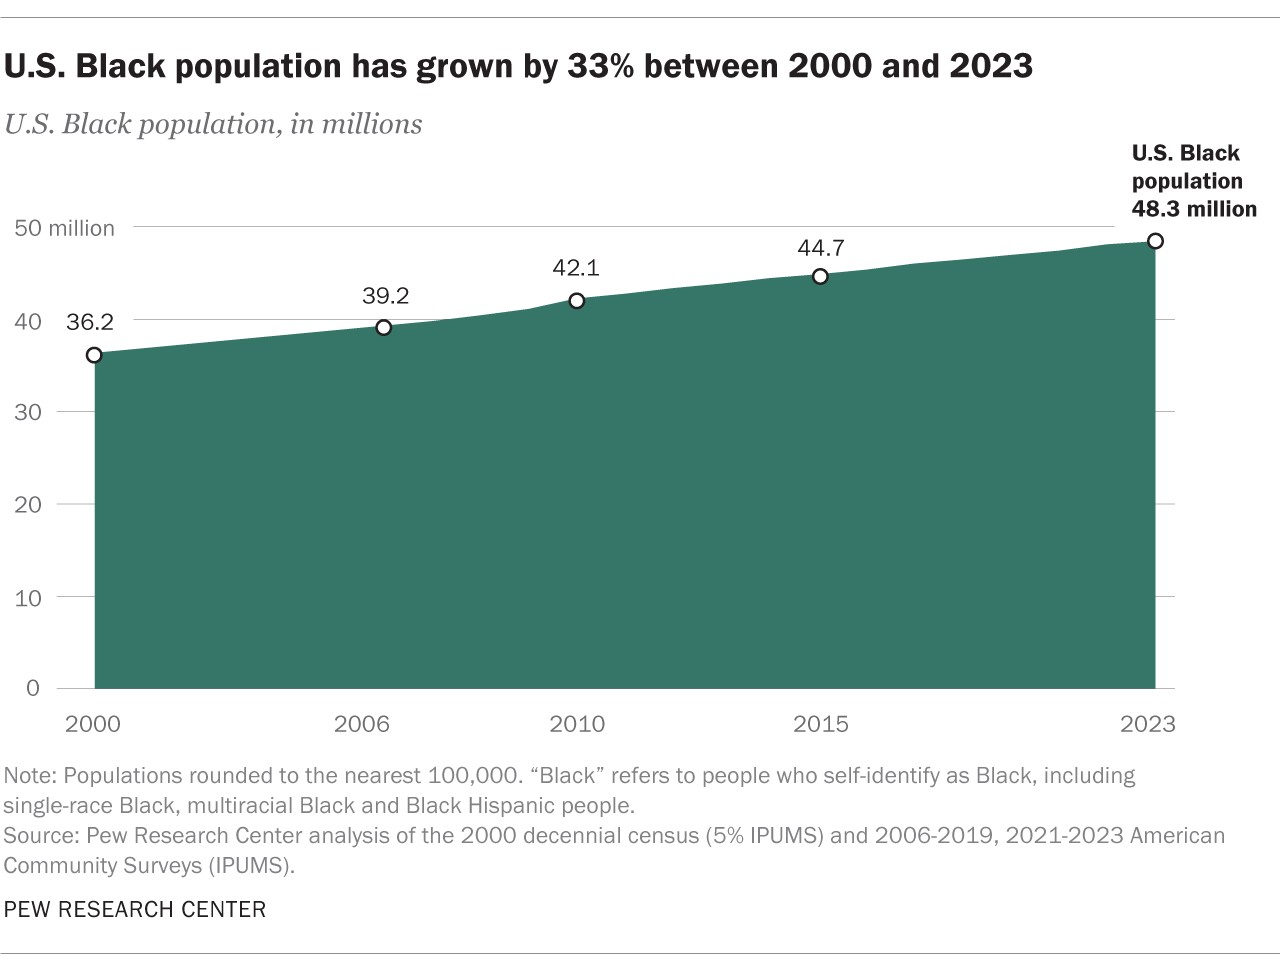
The demographic landscape of the United States is constantly evolving, and race remains a critical aspect of understanding its composition. In 2023, approximately 48.3 million people in the U.S. identified as Black, representing 14.4% of the nation’s total population. This figure marks a significant 33% increase since 2000, when the Black population stood at 36.2 million. This growth underscores the increasing prominence and influence of Black Americans in the fabric of American society.
This article delves into the multifaceted nature of the Black population in the U.S., drawing on data from the Census Bureau’s 2023 American Community Survey (ACS). We will explore not only the overall percentage of Black Americans but also examine the diverse subgroups within this population, including single-race, multiracial, and Hispanic Black individuals. By analyzing demographic, geographic, and socioeconomic characteristics, we aim to provide a comprehensive understanding of who Black Americans are today.
Growth of the Black Population in the U.S.
The Black population in the United States is not only substantial but also experiencing significant growth. As highlighted, the number of Black Americans has increased by 33% since the turn of the millennium. This expansion reflects broader demographic trends and the evolving understanding of racial identity in the U.S.
Key Growth Statistics:
- Total Black Population (2023): 48.3 million (14.4% of U.S. population)
- Total Black Population (2000): 36.2 million
- Increase since 2000: 33% or 12 million people
Immigration as a Factor:
Immigration plays an increasingly important role in the growth of the Black population. In 2023, over 5 million Black Americans were born outside the United States, accounting for approximately 11% of the total Black population. This is a notable increase from 2000, when foreign-born individuals comprised only 7% of the Black population. This influx of immigrants adds to the diversity of experiences and backgrounds within the Black community.
Breakdown by Racial Identity: Single-Race, Multiracial, and Hispanic Black
To gain a deeper understanding of the Black population, it is crucial to examine its various subgroups. The data from the 2023 ACS allows us to differentiate between single-race, multiracial, and Hispanic Black individuals.
1. Single-Race, Non-Hispanic Black Population:
This group constitutes the largest segment within the Black population. In 2023, there were 39.6 million single-race, non-Hispanic Black people, representing 82% of the total Black population. This group has also experienced growth, increasing by 17% since 2000.
- Population (2023): 39.6 million
- Percentage of Total Black Population: 82%
- Growth since 2000: 17%
Similar to the overall Black population, immigration contributes to the single-race Black group. Over 4 million individuals in this subgroup are immigrants, representing 11% of the single-race Black population in 2023.
2. Multiracial, Non-Hispanic Black Population:
The multiracial Black population is the second-largest subgroup and has experienced the most rapid growth. In 2023, there were 5.6 million multiracial, non-Hispanic Black people, making up 12% of the total Black population. This group has seen a remarkable 269% increase since 2000, reflecting changing patterns of racial identification and increasing interracial marriages.
- Population (2023): 5.6 million
- Percentage of Total Black Population: 12%
- Growth since 2000: 269%
While the number of foreign-born multiracial Black people has increased, their share of the multiracial Black population has decreased slightly since 2000, suggesting that much of this growth is driven by births within the U.S.
3. Black Hispanic Population:
The Black Hispanic population is the smallest subgroup analyzed but still significant. In 2023, there were 3.0 million Black Hispanic people, accounting for 6% of the total Black population. This group has grown by 210% since 2000.
- Population (2023): 3.0 million
- Percentage of Total Black Population: 6%
- Growth since 2000: 210%
It’s important to note that the Black Hispanic population is distinct from the Afro-Latino population. While there is overlap, not all Black Hispanics identify as Afro-Latino, and vice versa.
Age Demographics of Black Americans
The Black population in the U.S. is notably younger than the overall U.S. population. In 2023, the median age of Black Americans was 32.6 years, compared to 38.2 years for the U.S. population as a whole. This youthful age structure has implications for various aspects of society, including education, workforce, and social services.
Age Breakdown:
- Under 20 years old: Approximately 30% of the Black population
- 65 years and older: Approximately 12% of the Black population
Fertility Rates:
The general fertility rate among Black females aged 15 to 44 was 5.8% in 2023. This indicates the percentage of women in this age group who had a birth in the preceding year.
Age Variations within Subgroups:
- Single-Race Black: Median age of 35.4 years.
- Multiracial Black: Significantly younger, with a median age of just 19.5 years.
- Black Hispanic: Median age of 21.7 years, the second-youngest subgroup.
These age differences across subgroups highlight the diverse demographic trajectories within the broader Black population.
Language Diversity within the Black Community
While English is the predominant language, the Black population exhibits linguistic diversity, reflecting its global origins and cultural richness.
English Language Proficiency:
The vast majority (96%) of Black Americans speak English proficiently, either as their only language (88%) or by speaking another language at home and also speaking English “very well” (8%).
Other Languages Spoken:
Besides English, other languages spoken at home by Black Americans include:
- Spanish: 4%
- French or Haitian Creole: 3%
- Niger-Congo languages: 1%
- Amharic and other Ethiopian languages: 1%
Language Variations by Subgroup:
- Single-Race Black: Language patterns are similar to the total Black population, with a slight increase in French or Haitian Creole speakers.
- Multiracial Black: Even higher English proficiency (98%), with Spanish being the most common non-English language (2%).
- Black Hispanic: Lower English-only speakers (52%) but a high percentage (30%) who speak another language (primarily Spanish) at home and also speak English very well. Spanish is spoken at home by 46% of Black Hispanics.
Geographic Distribution of Black Americans
The geographic distribution of the Black population in the U.S. is not uniform, with significant concentrations in certain regions and states.
Regional Concentration:
Over half (56%) of Black Americans reside in the South. Other regions with notable Black populations include:
- Midwest: 17%
- Northeast: 17%
- West: 10%
Top States by Black Population:
- Texas: 4.3 million
- Florida: 4.0 million
- Georgia: 3.7 million
Metropolitan Areas with Largest Black Populations:
- New York City Metro Area: 3.8 million
- Atlanta Metro Area: 2.3 million
- Washington, D.C. Metro Area: 1.8 million
Geographic Variations by Subgroup:
- Single-Race Black: Even more concentrated in the South (59%).
- Multiracial Black: More dispersed geographically, with a significant presence in the South (42%) but also in the Midwest, West, and Northeast. California, Florida, and Texas are top states for this group.
- Black Hispanic: Concentrated in the Northeast and South (71% combined), with New York and Florida as top states.
Household Income of Black Households
Household income provides insights into the economic well-being of Black Americans. In 2023, the median household income for households headed by a Black person was $54,000.
Income Distribution:
- Households earning $75,000 or more: 37%
- Households earning $100,000 or more: 25%
Income Variations by Subgroup:
- Single-Race Black: Median household income of $52,800.
- Multiracial Black: Higher median household income of $65,800.
- Black Hispanic: Median household income of $60,000.
These income variations suggest different economic realities across the subgroups within the Black population.
Household Types within the Black Community
Household type provides a glimpse into the living arrangements and family structures within the Black population.
Household Structure:
- Married-couple households: 39% of Black people live in these households.
- Female-headed households: 30%
- Male-headed households: 5%
- Nonfamily households: 17%
Household Type Variations by Subgroup:
- Multiracial Black: Higher percentage living in married-couple households (45%) and lower percentage in nonfamily households.
- Black Hispanic: Similar to the total Black population in household type distribution.
- Single-Race Black: Similar to the total Black population in household type distribution.
Educational Attainment of Black Adults
Educational attainment is a key indicator of socioeconomic mobility and opportunity. Among Black adults aged 25 and older in 2023:
- Bachelor’s degree or higher: 27% (16% bachelor’s, 11% advanced degree)
- Some college, no bachelor’s degree: 32%
- High school graduate or less: 30%
Educational Attainment Variations by Subgroup:
- Multiracial Black: Higher educational attainment, with 35% having a bachelor’s degree or higher.
- Black Hispanic: 28% with a bachelor’s degree or higher, slightly above the total Black population.
- Single-Race Black: Slightly lower at 26% with a bachelor’s degree or higher.
Conclusion
In 2023, Black Americans constitute a significant and growing segment of the U.S. population, representing 14.4% of the nation. This detailed analysis reveals a diverse community characterized by varied racial and ethnic identities, age structures, geographic distributions, economic circumstances, and educational backgrounds. Understanding these nuances is essential for comprehending the multifaceted experiences of Black Americans and their evolving role in American society. The continued growth and diversification of the Black population will undoubtedly shape the demographic and social fabric of the United States in the years to come.