Are you curious about thematic maps and how they can help visualize data? At WHAT.EDU.VN, we provide clear and concise answers to your questions, offering you a hassle-free way to understand this powerful mapping technique. Discover the world of thematic cartography and learn how it transforms data into insightful visual stories, offering key information and geographical context. Explore various map types and geographical analysis, all in one place.
1. Understanding Thematic Maps
Thematic maps, unlike general reference maps, concentrate on a specific subject or theme, such as population density, climate patterns, or economic distribution. They present spatial variations of particular themes, making it easier to understand patterns and relationships. These maps spotlight a single topic, differentiating themselves from reference maps which showcase a variety of features including roads, geographical attributes, and administrative divisions.
Thematic maps are designed to highlight spatial patterns and reveal insights about the chosen theme.
2. The Purpose of Thematic Maps
Thematic maps are valuable tools for analyzing the geographical distribution of information, uncovering trends, and spotting correlations between different locations. They transform raw data into visual stories, revealing insights that might be hidden in spreadsheets.
By visualizing location-based information, thematic maps make it simpler to identify key patterns and trends.
3. Key Elements of a Thematic Map
A thematic map consists of several key elements that work together to convey information effectively:
- Title: Clearly states the theme of the map.
- Legend: Explains the symbols, colors, or patterns used to represent data.
- Data Representation: Uses visual elements to display the thematic information.
- Base Map: Provides geographical context with basic features like boundaries and locations.
- Scale: Indicates the relationship between distances on the map and actual distances on the ground.
These elements ensure that the map communicates the intended message clearly and accurately.
4. Common Types of Thematic Maps
4.1. Choropleth Maps
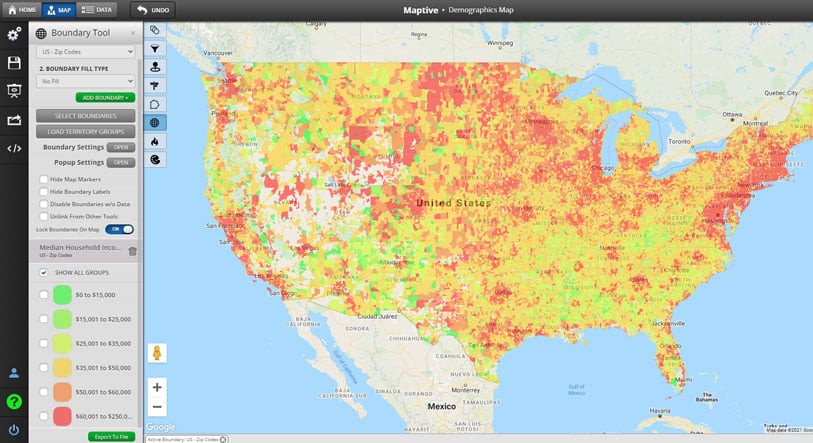
Choropleth maps use different colors or patterns to represent data values within predefined geographic areas. Each color or pattern corresponds to a specific range of data, allowing for easy visual comparison across regions.
Choropleth maps are ideal for representing data that is aggregated by area, such as population density or income levels.
4.1.1. Best Uses for Choropleth Maps:
- Measuring population density and total population
- Visualizing sales volume and revenue
- Measuring demographics like education, housing, per capita income, and labor
4.1.2. Advantages of Choropleth Maps:
- Quickly understand large volumes of data.
- Widely used and easily understood.
- Fast and simple to prepare with tools like Maptive.
4.1.3. Disadvantages of Choropleth Maps:
- Better suited for generalized data than specific figures.
- Data classes can be manipulated to mislead.
4.1.4. Bivariate Choropleth Maps
Bivariate Choropleth maps visualize two variables simultaneously using color-coded or patterned classes.
This type of map is useful for analyzing contrasting datasets, such as comparing year-to-year performance.
4.1.5. Value by Alpha Maps
Value by Alpha maps are a type of Bivariate Choropleth map where transparency is used to reflect the concentration of data. The more opaque the data, the higher the concentration.
These maps are often used to track elections, with opacity indicating voter turnout.
4.2. Dot Density Maps
Dot density maps use dots to represent data points, with the density of dots indicating the concentration of data in a given area.
These maps are effective for showing the distribution of data across a geographic area.
4.2.1. Best Uses for Dot Density Maps:
- Representing large quantities of geographically dispersed data
- Analyzing density and spatial patterns
- Printing or presenting black-and-white maps
4.2.2. Advantages of Dot Density Maps:
- More accessible for those who are color-blind.
- Allow for more precise visualization than heat maps.
- Can visualize either exact figures or classes.
4.2.3. Disadvantages of Dot Density Maps:
- Can be difficult to interpret if the dot density is too high.
- May not be suitable for representing data with low variability.
4.3. Isopleth Maps
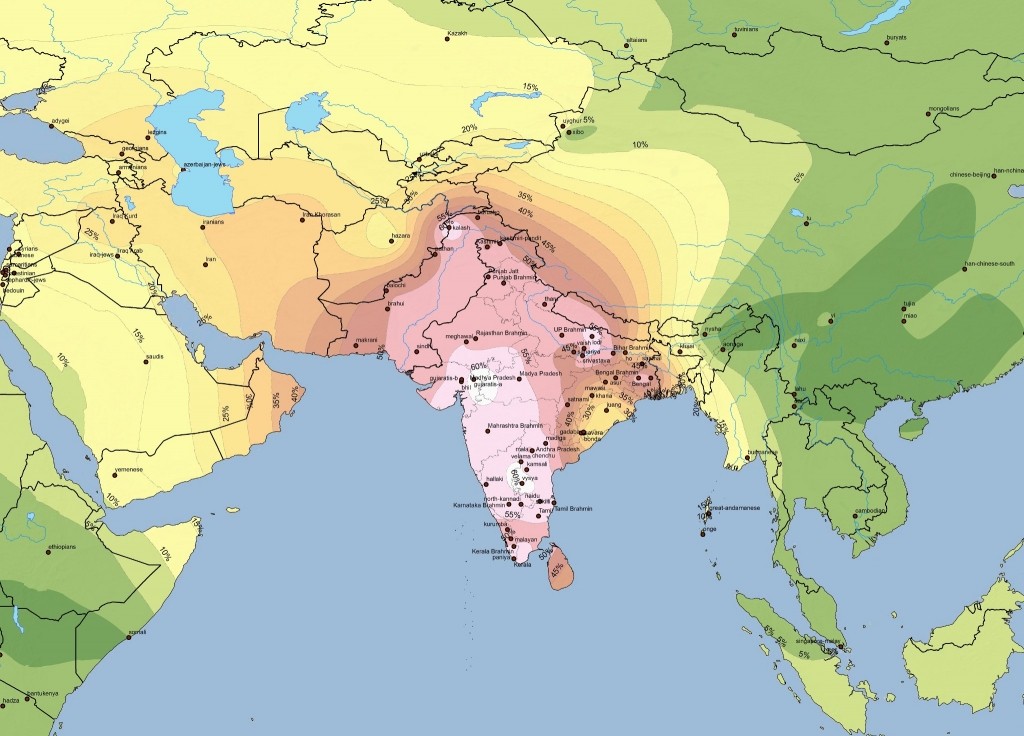
Isopleth maps use lines to connect points of equal value, representing continuous data such as temperature or elevation.
These maps are useful for visualizing data that varies smoothly over space.
4.3.1. Best Uses for Isopleth Maps:
- Mapping weather and climate patterns
- Visualizing data for large regions
- Measuring change over time or distance
4.3.2. Advantages of Isopleth Maps:
- Well-suited for large-scale analysis.
- Best for natural data like rainfall and temperature.
4.3.3. Disadvantages of Isopleth Maps:
- Prone to over-generalization.
- May not account for sudden or atypical results.
4.4. Heat Maps
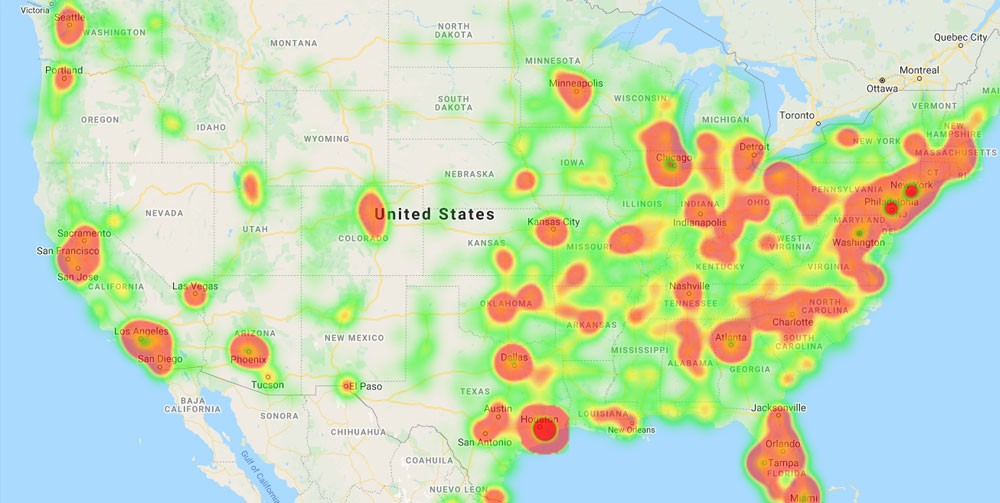
Heat maps use color gradients to represent data density, with darker colors indicating higher concentrations of data.
These maps are useful for identifying hotspots and patterns in data.
4.4.1. Best Uses for Heat Maps:
- Sales and marketing analysis
- Measuring the density, concentration, and intensity of data
- Discovering market opportunities
4.4.2. Advantages of Heat Maps:
- Best for outbound sales and marketing.
- Market analysis becomes easier.
- Help reveal sales opportunities.
4.4.3. Disadvantages of Heat Maps:
- Lose efficacy when used for data with low variance.
- Vulnerable to skewed perceptions when given incomplete data.
4.5. Graduated Symbol Maps
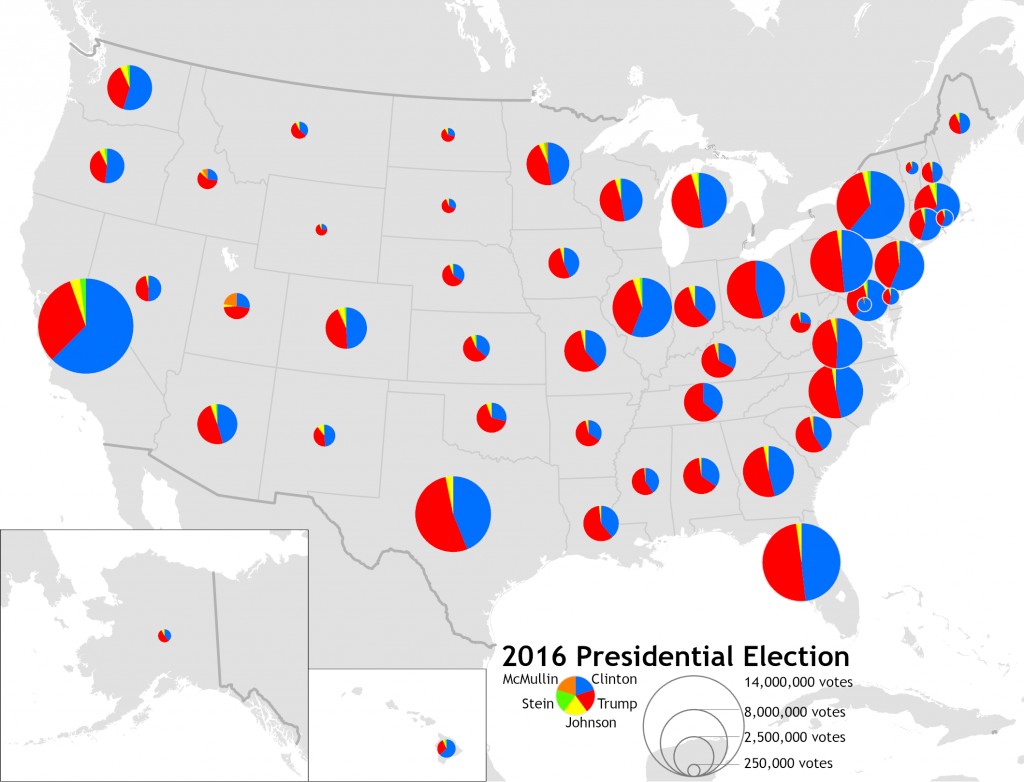
Graduated symbol maps use symbols of varying sizes to represent different data values, with larger symbols indicating higher values.
These maps are useful for visualizing both the location and magnitude of data.
4.5.1. Best Uses for Graduated Symbol Maps:
- Visualizing concentration and categorization of data simultaneously
- In-depth analysis for sales teams and political campaigns
- Presenting demographic makeup with population density
4.5.2. Advantages of Graduated Symbol Maps:
- Present two variables of data simply.
- Turn markers into comprehensive data points.
- Reduce distraction and clutter.
4.5.3. Disadvantages of Graduated Symbol Maps:
- May be hard to accurately measure the difference in magnitude between markers.
- Can become cluttered and hard to read without proper software.
4.6. Cartograms
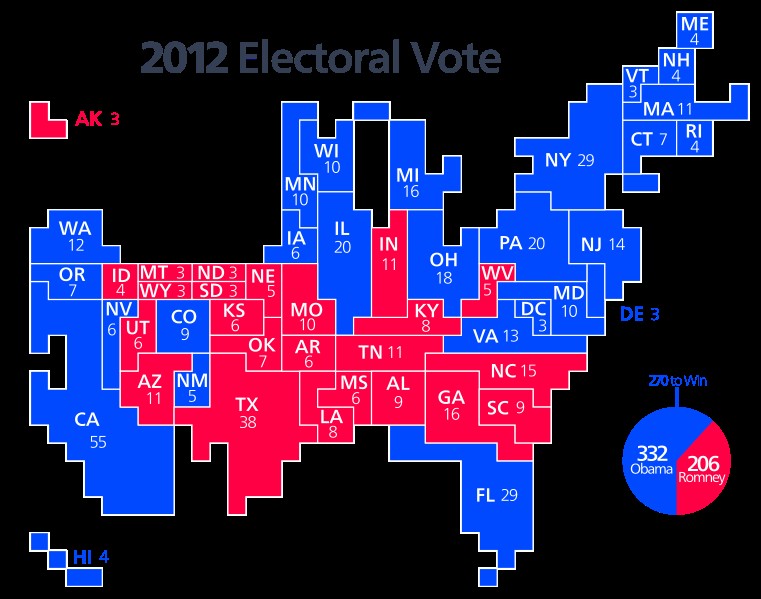
Cartograms distort the size and shape of geographic areas to represent data values, with larger areas indicating higher values.
These maps are useful for emphasizing the magnitude of data relative to geographic area.
4.6.1. Best Uses for Cartograms:
- Visualizing statistical data
- Emphasizing specific regional attributes
4.6.2. Advantages of Cartograms:
- Visually striking and memorable
- Effective for highlighting specific data
4.6.3. Disadvantages of Cartograms:
- Can distort geographic accuracy
- May be difficult to interpret for those unfamiliar with the technique
5. How to Choose the Right Thematic Map
Choosing the right thematic map depends on the type of data you are working with and the message you want to convey. Consider the following factors:
- Type of Data: Is your data discrete or continuous?
- Geographic Area: Are you mapping data for small areas or large regions?
- Audience: Who is your target audience?
- Purpose: What message do you want to convey?
By considering these factors, you can select the thematic map that best suits your needs.
6. Applications of Thematic Maps in Various Fields
Thematic maps are used across various fields to visualize and analyze data:
- Geography: Analyzing spatial patterns and relationships.
- Environmental Science: Mapping pollution levels and deforestation.
- Public Health: Tracking disease outbreaks and health trends.
- Business: Visualizing market data and sales territories.
- Urban Planning: Mapping population density and land use.
These applications demonstrate the versatility and value of thematic maps in understanding and addressing real-world issues.
7. Creating Thematic Maps with GIS Software
Creating thematic maps is easier than ever with Geographic Information System (GIS) software like QGIS, ArcGIS, and Maptive. These tools offer a range of features for importing data, customizing map elements, and generating high-quality thematic maps.
8. Thematic Maps vs. Reference Maps
Understanding the distinction between thematic and reference maps is crucial for effective cartography. Reference maps serve as comprehensive guides, showcasing a variety of geographical elements like roads, boundaries, and landmarks. They’re designed for navigation and general orientation. In contrast, thematic maps focus on a specific subject, using geographical context to illustrate a particular theme or data set.
Thematic maps are ideal for data visualization, while reference maps excel in providing geographical context.
9. The Evolution of Thematic Mapping
Thematic mapping has evolved significantly over the centuries, from early hand-drawn maps to today’s sophisticated digital visualizations. Advances in technology, such as GIS software and satellite imagery, have revolutionized the field, allowing for more accurate and detailed thematic maps.
This evolution has expanded the possibilities for data visualization and analysis.
10. Advantages of Using Thematic Maps
Using thematic maps offers several advantages:
- Enhanced Understanding: Simplifies complex data.
- Effective Communication: Conveys information visually.
- Pattern Identification: Reveals spatial trends.
- Informed Decision-Making: Supports strategic planning.
- Engaging Presentation: Captures audience attention.
These advantages make thematic maps a valuable tool for data analysis and communication.
11. Challenges in Creating Thematic Maps
Despite their benefits, creating thematic maps can present challenges:
- Data Quality: Ensuring accuracy and completeness.
- Map Design: Choosing appropriate symbols and colors.
- Data Interpretation: Avoiding misinterpretation of patterns.
- Software Proficiency: Mastering GIS software.
Addressing these challenges is essential for creating effective and reliable thematic maps.
12. Best Practices for Designing Thematic Maps
To create effective thematic maps, follow these best practices:
- Simplify: Keep the map clear and uncluttered.
- Choose Appropriate Symbols: Use symbols that accurately represent the data.
- Use Color Effectively: Select colors that enhance readability.
- Provide Context: Include a legend and scale.
- Test: Ensure the map is easy to understand.
By following these practices, you can create thematic maps that effectively communicate your message.
13. The Role of Color in Thematic Maps
Color plays a crucial role in thematic maps, influencing how data is perceived and interpreted. Effective use of color can enhance readability, highlight patterns, and convey meaning. However, poor color choices can confuse viewers and distort the message.
When selecting colors for thematic maps, consider the following:
- Color Schemes: Use sequential, diverging, or qualitative schemes.
- Colorblindness: Ensure the map is accessible to colorblind viewers.
- Contrast: Provide sufficient contrast between colors.
- Meaning: Use colors that align with the data’s meaning.
By carefully considering these factors, you can use color to enhance the effectiveness of your thematic maps.
14. Thematic Maps and Spatial Analysis
Thematic maps are closely linked to spatial analysis, which involves examining the location, distribution, and relationships of geographic phenomena. Spatial analysis techniques can be used to identify patterns, clusters, and anomalies in thematic map data, providing valuable insights for decision-making.
Common spatial analysis techniques used with thematic maps include:
- Spatial Autocorrelation: Measuring the degree to which values are clustered in space.
- Hot Spot Analysis: Identifying statistically significant clusters of high or low values.
- Overlay Analysis: Combining multiple layers of data to identify relationships.
By integrating spatial analysis techniques with thematic maps, you can gain a deeper understanding of geographic patterns and processes.
15. Future Trends in Thematic Mapping
Thematic mapping continues to evolve with advancements in technology and data availability. Some future trends in thematic mapping include:
- Interactive Maps: Web-based maps that allow users to explore data dynamically.
- Real-Time Data: Maps that display up-to-date information.
- 3D Mapping: Visualizing data in three dimensions.
- Mobile Mapping: Accessing maps on smartphones and tablets.
These trends will continue to transform the way we visualize and analyze geographic data.
16. How Thematic Maps Aid in Decision-Making
Thematic maps play a crucial role in informed decision-making across various sectors by providing visual representations of complex data.
- Urban Planning: Thematic maps help urban planners visualize population density, land use, and transportation networks, enabling them to make informed decisions about zoning, infrastructure development, and resource allocation.
- Public Health: Thematic maps are used to track the spread of diseases, identify high-risk areas, and allocate resources for healthcare interventions. By mapping disease incidence rates, healthcare providers can make data-driven decisions about resource allocation, vaccination campaigns, and public health interventions.
- Environmental Management: Thematic maps are used to visualize environmental data such as air and water quality, deforestation rates, and biodiversity hotspots. Environmental managers use thematic maps to monitor environmental changes, assess the impact of human activities, and develop strategies for conservation and sustainable resource management.
- Business and Marketing: Businesses use thematic maps to analyze market trends, identify potential customers, and optimize their marketing strategies. By mapping sales data, demographic information, and competitor locations, businesses can make informed decisions about market entry, product placement, and advertising campaigns.
- Emergency Response: Thematic maps are essential tools for emergency responders during natural disasters such as hurricanes, earthquakes, and floods. By mapping affected areas, infrastructure damage, and evacuation routes, emergency responders can coordinate relief efforts, allocate resources, and save lives.
Thematic maps provide a visual and spatial context that enhances understanding and enables decision-makers to make informed choices based on data-driven insights.
17. Interactive vs. Static Thematic Maps
Interactive thematic maps offer dynamic features like zooming, panning, and data querying, allowing users to explore data in detail. Static maps, in contrast, provide a fixed view of data, suitable for print or presentations.
Interactive maps enhance user engagement, while static maps ensure consistency and accessibility.
18. The Importance of Data Normalization
Data normalization is essential in thematic mapping to ensure accurate comparisons between different geographic areas. Normalization involves adjusting data values to account for variations in population size, area, or other factors.
Without normalization, thematic maps can be misleading, as larger areas may appear to have higher values simply because they are larger.
19. How Thematic Maps Support Education
Thematic maps are powerful tools for enhancing education across various disciplines. By visually representing complex data, thematic maps make it easier for students to understand and analyze geographic phenomena.
- Geography: Thematic maps are used to teach students about population distribution, climate patterns, and economic activities. Students can explore different types of thematic maps, such as choropleth maps, dot density maps, and isopleth maps, to learn about spatial relationships and geographic patterns.
- History: Thematic maps are used to visualize historical events, such as the spread of empires, trade routes, and migration patterns. Students can use thematic maps to analyze the causes and consequences of historical events and understand the spatial dimensions of history.
- Social Studies: Thematic maps are used to explore social issues such as poverty, inequality, and access to healthcare. Students can use thematic maps to analyze the spatial distribution of social problems and identify potential solutions.
- Science: Thematic maps are used to visualize environmental data, such as air and water quality, deforestation rates, and biodiversity hotspots. Students can use thematic maps to analyze environmental changes, assess the impact of human activities, and develop strategies for conservation and sustainable resource management.
Thematic maps engage students, promote critical thinking, and enhance learning outcomes across various subjects.
20. Ethical Considerations in Thematic Mapping
Ethical considerations are paramount in thematic mapping to ensure accurate, unbiased, and responsible representation of data. Mappers must be aware of potential biases in data collection, analysis, and visualization, and take steps to mitigate them.
- Data Accuracy: Ensure data accuracy by verifying sources, correcting errors, and acknowledging limitations.
- Map Projections: Choose appropriate map projections that minimize distortion and accurately represent spatial relationships.
- Color Schemes: Use color schemes that are accessible to all viewers, including those with color vision deficiencies, and avoid using colors that perpetuate stereotypes or biases.
- Data Privacy: Protect data privacy by aggregating data to appropriate levels, anonymizing personal information, and obtaining consent when necessary.
By adhering to ethical principles, mappers can create thematic maps that inform, educate, and empower viewers while minimizing potential harm.
21. Case Studies: Successful Applications of Thematic Maps
Numerous case studies demonstrate the successful application of thematic maps in various fields.
- Disease Mapping: Thematic maps have been used to track the spread of infectious diseases like Ebola and COVID-19, helping public health officials identify hotspots, allocate resources, and implement targeted interventions.
- Election Analysis: Thematic maps are used to analyze election results, visualize voting patterns, and identify demographic factors that influence voter behavior. Political analysts use thematic maps to understand electoral trends, predict election outcomes, and develop campaign strategies.
- Environmental Monitoring: Thematic maps are used to monitor environmental changes such as deforestation, desertification, and sea-level rise. Environmental scientists use thematic maps to assess the impact of human activities on the environment, identify areas of concern, and develop strategies for conservation and sustainable resource management.
- Business Expansion: Businesses use thematic maps to analyze market trends, identify potential customers, and optimize their retail locations. Market analysts use thematic maps to assess market demand, identify underserved areas, and make informed decisions about business expansion.
These case studies illustrate the diverse applications of thematic maps and their potential to inform decision-making, solve problems, and improve outcomes across various sectors.
22. Common Mistakes to Avoid in Thematic Mapping
Several common mistakes can undermine the effectiveness of thematic maps.
- Overcrowding: Avoid overcrowding the map with too much data or unnecessary details.
- Inconsistent Symbolism: Use consistent symbolism throughout the map to avoid confusion.
- Poor Color Choices: Avoid using colors that are difficult to distinguish or that clash with each other.
- Lack of Context: Provide sufficient context by including a title, legend, scale, and source information.
By avoiding these mistakes, mappers can create thematic maps that are clear, accurate, and informative.
23. Accessibility Considerations for Thematic Maps
Accessibility considerations are essential in thematic mapping to ensure that maps are usable by people with disabilities.
- Colorblindness: Choose color schemes that are accessible to people with color vision deficiencies.
- Screen Readers: Design maps that are compatible with screen readers by providing alternative text descriptions for all map elements.
- Keyboard Navigation: Ensure that interactive maps can be navigated using a keyboard.
- Font Size: Use font sizes that are large enough to be easily read.
By addressing accessibility issues, mappers can create thematic maps that are inclusive and usable by everyone.
24. How Thematic Maps are Used in Urban Planning
Thematic maps play a vital role in urban planning by providing visual representations of complex data related to urban environments. Urban planners use thematic maps to analyze various aspects of cities, such as population density, land use, transportation networks, and socioeconomic characteristics.
- Land Use Planning: Thematic maps are used to visualize land use patterns, such as residential, commercial, industrial, and recreational areas. Urban planners use thematic maps to identify areas for redevelopment, prioritize infrastructure investments, and promote mixed-use development.
- Transportation Planning: Thematic maps are used to analyze transportation networks, traffic patterns, and accessibility. Urban planners use thematic maps to identify transportation bottlenecks, prioritize transportation investments, and promote sustainable transportation options such as public transit, biking, and walking.
- Housing Planning: Thematic maps are used to analyze housing characteristics, such as housing density, housing affordability, and housing quality. Urban planners use thematic maps to identify housing needs, prioritize housing investments, and promote affordable housing options.
- Environmental Planning: Thematic maps are used to visualize environmental data, such as air and water quality, green spaces, and floodplains. Urban planners use thematic maps to assess environmental impacts, prioritize environmental conservation, and promote sustainable development practices.
25. The Role of Thematic Maps in Environmental Conservation
Thematic maps are essential tools for environmental conservation, providing visual representations of complex data related to natural resources, ecosystems, and environmental challenges. Environmental conservationists use thematic maps to assess environmental conditions, monitor changes over time, and inform conservation strategies.
- Habitat Mapping: Thematic maps are used to identify and delineate critical habitats for endangered species, such as forests, wetlands, and coral reefs. Environmental conservationists use habitat maps to prioritize conservation efforts, protect biodiversity, and manage natural resources.
- Deforestation Monitoring: Thematic maps are used to monitor deforestation rates, track forest cover changes, and identify areas of illegal logging. Environmental conservationists use deforestation maps to assess the impact of deforestation on biodiversity, climate change, and ecosystem services.
- Protected Area Planning: Thematic maps are used to plan and manage protected areas, such as national parks, wildlife refuges, and marine reserves. Environmental conservationists use thematic maps to identify areas for conservation, design protected area boundaries, and monitor the effectiveness of conservation measures.
- Climate Change Assessment: Thematic maps are used to assess the impacts of climate change, such as sea-level rise, temperature changes, and extreme weather events. Environmental conservationists use thematic maps to identify vulnerable areas, assess risks, and develop adaptation strategies.
26. The Use of Thematic Maps in Political Science
Thematic maps are valuable tools in political science, offering insights into electoral patterns, demographic influences, and policy outcomes. Political scientists use thematic maps to analyze voting behaviors, understand the spatial distribution of political ideologies, and assess the impact of policies on different communities.
- Electoral Geography: Thematic maps are used to visualize election results, identify voting patterns, and analyze the geographic distribution of political support. Political scientists use electoral maps to understand the factors that influence voter behavior, such as demographics, socioeconomic status, and cultural values.
- Policy Mapping: Thematic maps are used to visualize the spatial distribution of policy outcomes, such as access to healthcare, educational attainment, and poverty rates. Political scientists use policy maps to assess the impact of policies on different communities, identify disparities, and advocate for policy changes.
- Geopolitics: Thematic maps are used to analyze geopolitical relationships, such as trade flows, military alliances, and territorial disputes. Political scientists use geopolitical maps to understand the dynamics of international relations, assess the strategic importance of different regions, and inform foreign policy decisions.
- Political Demography: Thematic maps are used to analyze the demographic characteristics of political districts, such as age, race, ethnicity, and income. Political scientists use demographic maps to understand the demographic factors that influence political behavior, such as voter turnout, party affiliation, and policy preferences.
27. Exploring Thematic Maps in Historical Context
Thematic maps provide a unique lens through which to explore historical events, social changes, and economic developments. By visualizing data across time and space, thematic maps offer insights into the causes and consequences of historical phenomena.
- Mapping Disease Spread: Thematic maps have been used to track the spread of diseases throughout history, such as the Black Death, cholera outbreaks, and the Spanish Flu. Historians use disease maps to understand the factors that contributed to the spread of diseases, such as population density, trade routes, and sanitation practices.
- Visualizing Migration Patterns: Thematic maps are used to visualize migration patterns throughout history, such as the Great Migration, the Irish Potato Famine, and the European colonization of the Americas. Historians use migration maps to understand the causes and consequences of migration, such as economic opportunities, political persecution, and environmental disasters.
- Analyzing Trade Routes: Thematic maps are used to analyze trade routes throughout history, such as the Silk Road, the transatlantic slave trade, and the spice trade. Historians use trade maps to understand the economic and cultural exchange between different regions, as well as the impact of trade on social and political structures.
- Mapping Territorial Changes: Thematic maps are used to visualize territorial changes throughout history, such as the expansion of empires, the redrawing of national boundaries, and the establishment of new states. Historians use territorial maps to understand the dynamics of power, conflict, and cooperation between different political entities.
28. The Role of Remote Sensing in Thematic Mapping
Remote sensing technologies, such as satellite imagery and aerial photography, play a crucial role in thematic mapping by providing data about the Earth’s surface. Remote sensing data is used to create thematic maps of land cover, vegetation, water resources, and other environmental features.
- Land Cover Mapping: Remote sensing data is used to create thematic maps of land cover, such as forests, grasslands, wetlands, and urban areas. Land cover maps are used to monitor land use changes, assess environmental impacts, and manage natural resources.
- Vegetation Monitoring: Remote sensing data is used to monitor vegetation health, assess biomass, and track changes in vegetation cover. Vegetation maps are used to monitor deforestation, assess the impact of climate change on vegetation, and manage agricultural resources.
- Water Resource Mapping: Remote sensing data is used to map water bodies, monitor water quality, and assess water availability. Water resource maps are used to manage water resources, assess the impact of drought on water supplies, and monitor water pollution.
- Urban Mapping: Remote sensing data is used to map urban areas, assess urban growth, and monitor urban environmental conditions. Urban maps are used to plan urban infrastructure, assess the impact of urbanization on the environment, and manage urban resources.
29. Emerging Technologies and Thematic Maps
Several emerging technologies are transforming the field of thematic mapping, enabling new applications and enhancing the capabilities of thematic maps.
- Artificial Intelligence (AI): AI algorithms are used to automate the process of data analysis, pattern recognition, and map creation. AI-powered thematic maps can generate insights more quickly and accurately than traditional methods.
- Big Data Analytics: Big data analytics techniques are used to analyze large datasets, identify trends, and create thematic maps that reveal hidden patterns. Big data-driven thematic maps provide insights into complex phenomena, such as consumer behavior, social networks, and environmental changes.
- Cloud Computing: Cloud computing platforms provide scalable computing resources, data storage, and mapping services that enable users to create and share thematic maps more easily. Cloud-based thematic mapping platforms facilitate collaboration, data sharing, and map dissemination.
- Virtual Reality (VR) and Augmented Reality (AR): VR and AR technologies are used to create immersive thematic maps that allow users to explore data in three dimensions. VR and AR thematic maps provide engaging and interactive experiences that enhance understanding and promote learning.
30. Frequently Asked Questions (FAQs) about Thematic Maps
| Question | Answer |
|---|---|
| What is the main purpose of a thematic map? | To visualize spatial patterns and relationships of a specific theme or subject. |
| How do thematic maps differ from reference maps? | Thematic maps focus on a single topic, while reference maps show a variety of features like roads and boundaries. |
| What are some common types of thematic maps? | Choropleth maps, dot density maps, isopleth maps, heat maps, graduated symbol maps, and cartograms. |
| What software can be used to create thematic maps? | GIS software like QGIS, ArcGIS, and Maptive. |
| What factors should be considered when choosing a thematic map type? | Type of data, geographic area, audience, and purpose of the map. |
| How can thematic maps be used in urban planning? | To visualize population density, land use, transportation networks, and other aspects of urban environments. |
| What are some ethical considerations in thematic mapping? | Ensuring data accuracy, using appropriate map projections, and avoiding biased color schemes. |
| How can remote sensing be used in thematic mapping? | To collect data about the Earth’s surface, such as land cover, vegetation, and water resources. |
| What are some emerging technologies in thematic mapping? | Artificial intelligence, big data analytics, cloud computing, and virtual reality. |
| What is data normalization and why is it important? | Adjusting data values to account for variations in population size, area, or other factors, ensuring accurate comparisons between different geographic areas. |
Do you still have questions about thematic maps? Visit WHAT.EDU.VN to ask your questions and receive free answers from our community of experts.
Thematic maps are powerful tools for visualizing and analyzing geographic data, enabling informed decision-making across various fields. By understanding the different types of thematic maps, their applications, and best practices for their creation, you can effectively communicate insights and address real-world challenges.
Are you struggling to find quick, free answers to your questions? Unsure where to turn for reliable information? At WHAT.EDU.VN, we understand your challenges. That’s why we offer a free platform where you can ask any question and receive prompt, accurate responses from knowledgeable individuals.
Don’t let unanswered questions hold you back. Visit WHAT.EDU.VN today and experience the convenience and reliability of our free question-and-answer service.
Address: 888 Question City Plaza, Seattle, WA 98101, United States
WhatsApp: +1 (206) 555-7890
Website: what.edu.vn