Thin layer chromatography (TLC) is a versatile and widely used chromatographic technique for separating components of a mixture. It utilizes a thin stationary phase, typically silica gel, alumina, or cellulose, coated on an inert support like glass, aluminum, or plastic. TLC is employed in various applications, including reaction monitoring, compound identification, and small-scale purification. Its simplicity, low cost, high sensitivity, and speed make it an indispensable tool in many laboratories.
The Principle Behind TLC
TLC operates based on the principle of differential affinities of compounds for the mobile and stationary phases. Each compound in a mixture interacts differently with the two phases. Compounds with a stronger affinity for the stationary phase will migrate slower, while those with a greater affinity for the mobile phase will move faster. This difference in migration rates leads to the separation of the mixture’s components into distinct spots.
Retention Factor (Rf) in TLC
After separation, each compound appears as a spot at a specific vertical distance. The retention factor (Rf) is a crucial parameter for characterizing each spot. It is defined as the ratio of the distance traveled by the compound to the distance traveled by the solvent front:
[ R_f= dfrac{text{distance traveled by sample}}{text{distance traveled by solvent}} ]
The Rf value is characteristic of a compound under specific conditions and can be used for identification purposes. Under identical conditions, a less polar compound will exhibit a higher Rf value because it interacts less strongly with the polar stationary phase. Conversely, a more polar compound will have a lower Rf value due to its stronger interaction with the stationary phase.
Several factors can influence Rf values, including layer thickness, moisture on the TLC plate, chamber saturation, temperature, mobile phase depth, the nature of the TLC plate, sample size, and solvent parameters. Typically, these factors lead to an increase in Rf values. However, increased layer thickness can decrease the Rf value as the mobile phase ascends the plate more slowly.
To express positions relative to a reference substance (x), the relative retention value (Rx) is used:
[ R_x= dfrac{text{distance of compound from origin}}{text{distance of compound x from origin}} ]
While Rf values range from 0 to 1, Rx values can exceed 1, indicating that the compound migrates faster than the reference compound x.
TLC Apparatus: Plates and Mobile Phase
TLC Plates (Stationary Phase)
TLC plates, or chromatoplates, are available commercially or can be prepared in the lab. Common stationary phases include silica gel and alumina, each with distinct properties. Some plates incorporate a fluorescent compound that glows under short-wave UV light (254 nm), aiding in visualization. The backing material is typically glass, aluminum, or plastic.
Glass plates are chemically inert and heat-resistant but are brittle and difficult to cut. Aluminum and plastic plates are flexible and easily cut but may not withstand harsh stains or high temperatures. It’s crucial to handle TLC plates carefully by the edges or with forceps to avoid contamination.
The choice of stationary phase depends on the sample’s properties. Silica gel is suitable for amino acids, hydrocarbons, and steroids. Alumina, being basic, is less suited for acidic solutions. Consider the properties of the compounds you are separating when choosing the appropriate plate type.
Table 1: Stationary phase and mode of separation
| Stationary Phase | Chromatographic Mechanism | Typical Application |
|---|---|---|
| Silica Gel | adsorption | steroids, amino acids, alcohols, hydrocarbons, lipids, aflaxtoxin, bile, acids, vitamins, alkaloids |
| Silica Gel RP | reversed phase | fatty acids, vitamins, steroids, hormones, carotenoids |
| Cellulose, kieselguhr | partition | carbohydrates, sugars, alcohols, amino acids, carboxylic acids, fatty acids |
| Aluminum oxide | adsorption | amines, alcohols, steroids, lipids, aflatoxins, bile acids, vitamins, alkaloids |
| PEI cellulose | ion exchange | nucleic acids, nucleotides, nucelosides, purines, pyrimidines |
| Magnesium silicate | adsorption | steroids, pesticides, lipids, alkaloids |
Mobile Phase (Solvent)
Solvent selection is critical in TLC and often requires experimentation. Start with a common solvent mixture like 1:1 hexane:ethyl acetate and adjust the ratio to optimize separation. Rf values range from 0 to 1, with 0 indicating very low solvent polarity and 1 indicating very high polarity. Ideally, Rf values should fall between these extremes for optimal separation.
The solubility of the components in the chosen solvent and their affinity for the stationary phase are essential factors. If a compound is highly soluble in the solvent, it will travel further up the plate. Conversely, a strong affinity for the stationary phase will cause it to stick and move less.
Acids, bases, and strongly polar compounds may cause streaking in neutral solvents. Adding a small percentage of acetic acid, formic acid, or triethylamine can correct streaking for acids and bases, respectively. For polar compounds, a few percent of methanol may improve results.
Solvent volatility is also important, especially when using chemical stains. Residual solvent can react with the stain, obscuring spots. Volatile solvents should be used once, while nonvolatile solvents may require a vacuum chamber for removal.
Useful solvent mixtures include:
- Ethyl acetate: butanol: acetic acid: water (80:10:5:5) for strongly polar compounds.
- 10% NH4OH in methanol, diluted to 1-10% in dichloromethane, for strongly basic compounds.
- 10% methanol or less in dichloromethane for polar compounds.
TLC Pipettes
Thin glass pipettes are used to apply spots to the TLC plate. They should be thin enough to create neat spots but not so thin as to prevent adequate sample uptake. These pipettes are easily made by heating a glass capillary in a Bunsen burner flame and pulling the ends apart.
Spotting and Developing TLC Plates
Developing a TLC plate requires a developing chamber, such as a wide-mouth jar or specialized glassware. The chamber should contain enough solvent to cover the bottom and a piece of filter paper to saturate the atmosphere with solvent vapors. A lid is essential to minimize evaporation.
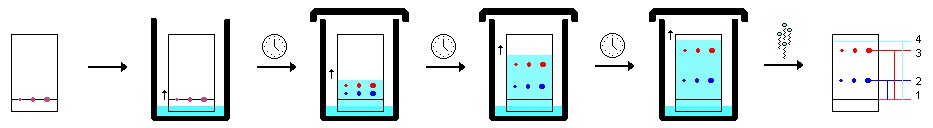
The following steps outline the spotting and developing process:
-
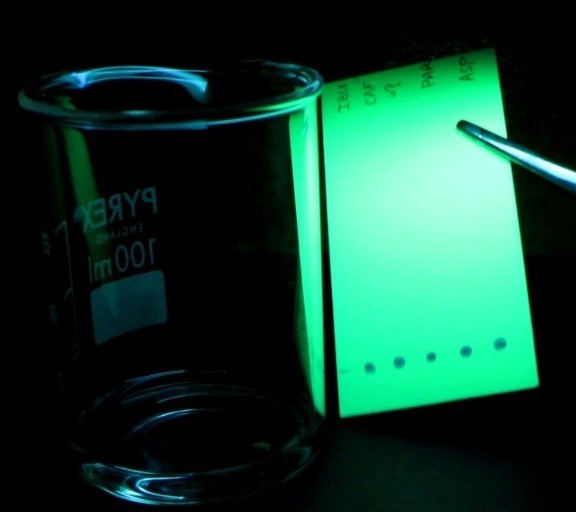
Cut the plate to the correct size and gently draw a line with a pencil (never a pen) approximately 1 cm from the bottom. Avoid excessive force to prevent removing the stationary phase.
-
Using TLC pipettes, apply spots of analyte to the line. Ensure sufficient sample is applied, which can be verified using short-wave UV light. If a standard of the target compound is available, co-spotting can confirm the identity of the target compound.
-
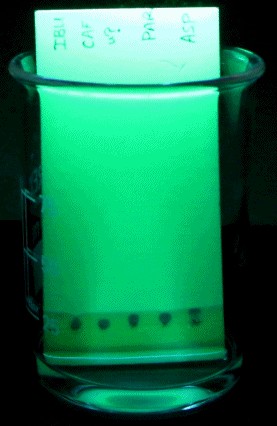
Place the plate in the chamber as evenly as possible, leaning it against the side. The solvent level must not exceed the drawn line.
-
Allow capillary action to draw the solvent up the plate until it is approximately 1 cm from the end.
-
Remove the plate and immediately draw a pencil line across the solvent front.
-
Visualize the components under short-wave UV light and circle the spots with a pencil.
Visualizing TLC Results
If using fluorescent plates, illuminate the plate with short-wave UV light to visualize UV-active compounds. Non-UV-active compounds require chemical stains for visualization. Iodine is a common stain, where plates are placed in a jar containing iodine crystals or covered in silica gel with dispersed iodine.
General-use stains like permanganate, ceric ammonium molybdate (CAM), and p-anisaldehyde are also popular. To develop a plate with permanganate, spray or dip the plate and heat it with a heat gun until spots appear. Overheating should be avoided to prevent obscuring the spots. CAM and p-anisaldehyde stained plates are developed similarly.
Common Problems in TLC
Several common issues can arise during TLC, which can usually be avoided with proper technique:
-
Over-large Spots: Spotting sizes should not exceed 1-2 mm in diameter to prevent overlapping of component spots.
-
Uneven Advance of Solvent Front: This can result from an uneven bottom, insufficient solvent, or an unevenly cut plate. Ensure the plate is placed evenly in the chamber and that sufficient solvent is used.
-
Streaking: Streaking occurs when the sample spot is too concentrated. Dilute the sample solution to avoid this issue.
-
Spotting Below Solvent Level: Ensure the sample spot is above the solvent level to prevent the sample from washing off into the solvent.
.gif)
Advantages and Disadvantages of TLC
TLC offers several advantages:
- Simplicity and Low Cost: TLC is easy to learn and requires minimal equipment.
- Versatility: It can separate multiple compounds simultaneously with easy solvent changes.
- Purity Assessment: TLC can be used to quickly assess the purity of a compound.
- Optimization: Chromatography conditions can be easily modified to optimize resolution.
However, TLC also has limitations:
- Limited Separation Length: The short stationary phase limits the length of separation.
- Higher Detection Limit: The detection limit is higher compared to other chromatographic techniques.
- Open System: Factors like humidity and temperature can affect results.
References
- Touchstone, Joseph C. Practice of thin layer chromatography. 2nd ed. New York: Wiley, 1983.Print.
- Geiss, Friedrich. Fundamentals of thin layer chromatography planar chromatography. Heidelberg: A. Hüthig, 1987. Print.
- Touchstone, Joseph C. Practice of thin layer chromatography. 3rd ed. New York: Wiley, 1992. Print.
- Figures: “Thin layer chromatography -.” Wikipedia, the free encyclopedia. Web. 03 Dec. 2009. <http://en.wikipedia.org/wiki/Thin_la…chromatography>.
Problems and Solutions
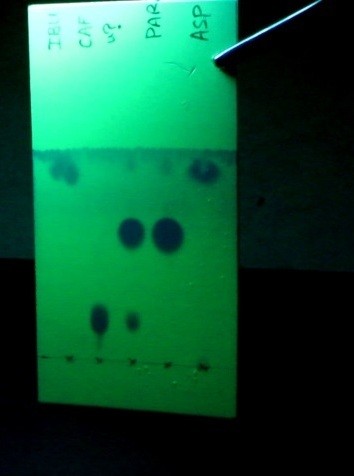
Figure 3: TLC plate under UV light with values for distance traveled of solvent and components.
Given:
#1=1.4 cm
#2= 1.5 cm
#3= 3.1 cm
#4= 3.6 cm
Using only the given information and the above figure, answer the problems listed below.
- What is the Rf value for component #2?
- What is the Rf value for component #3?
- What is the relative retention value for components #1 and #4, with #4 being compound x?
- Using the answers from questions 1 and 2 and assuming that components 2 and 3 are different compounds, which component would be considered more polar? Explain.
Answers
-
- 5/4.4=0.34
-
- 1/4.4=0.70
-
- 4/3.6=0.39
- Component #2 would be considered more polar because it has the lower Rf value, which means that it sticks to the stationary phase a lot stronger than component #3 and therefore moves slower in the mobile phase.