What is Earth’s population? Explore the current world population, historical trends, future projections, and fascinating facts with WHAT.EDU.VN, your go-to source for free answers to all your questions. Uncover insights into global demographics and understand the forces shaping our planet’s population distribution with our world population breakdown, population milestones, and population growth rate analysis.
Are you seeking answers to your burning questions? Visit WHAT.EDU.VN today and experience the ease and convenience of getting free, expert advice.
1. Understanding Earth’s Population: Past and Present
The Earth’s population has undergone a dramatic transformation throughout history. At the dawn of agriculture, around 8000 B.C., the world population was a mere 5 million. Over the subsequent 8,000 years, it steadily increased to around 200 million by 1 A.D. This represents an average annual growth rate of less than 0.05%.
A pivotal shift occurred with the advent of the Industrial Revolution. It took all of human history until approximately 1800 for the world population to reach one billion. However, the second billion was achieved in just 130 years (1930), followed by the third billion in 30 years (1960), the fourth billion in 15 years (1974), and the fifth billion in a mere 13 years (1987). The 20th century alone witnessed an unprecedented surge, with the global population soaring from 1.65 billion to 6 billion.
2. Current World Population and Growth Rate
As of today, the world population is estimated to be over 8 billion people. This number is constantly changing, but WHAT.EDU.VN stays updated with the latest estimates from reputable sources.
2.1. Growth Rate Trends
The annual population growth rate reached its peak in the mid-1960s at around 2%. Since then, it has nearly halved and is projected to continue declining.
Currently, the world population is growing at a rate of approximately 0.85% per year. This translates to an increase of roughly 70 million people annually.
2.2. Factors Affecting Growth Rate
Several factors contribute to the declining growth rate, including:
- Increased access to family planning services
- Rising levels of education, especially among women
- Economic development and urbanization
- Government policies aimed at managing population growth
3. Future Population Projections
The United Nations and other organizations regularly release population projections based on various scenarios.
3.1. Expected Milestones
- 9 Billion: World population is expected to reach 9 billion around 2037.
- 10 Billion: Projections indicate that world population will reach 10 billion around 2060.
- Long-Term Trends: The world population is expected to plateau around 10.2 billion by 2100.
3.2. Regional Variations
Population growth rates vary significantly across different regions. Africa is expected to experience the highest growth rate, while Europe may see a decline in population.
Understanding these trends is crucial for addressing challenges related to resource management, infrastructure development, and social services. Do you have questions about how population growth affects your community? Ask them on WHAT.EDU.VN and get free answers from experts.
4. Historical World Population Table
| Year (July 1) | Population | Yearly % Change | Yearly Change | Median Age | Fertility Rate | Density (P/Km²) |
|---|---|---|---|---|---|---|
| 2025 | 8,231,613,070 | 0.85% | 69,640,498 | 30.9 | 2.24 | 55 |
| 2024 | 8,161,972,572 | 0.87% | 70,237,642 | 30.6 | 2.25 | 55 |
| 2023 | 8,091,734,930 | 0.88% | 70,327,738 | 30.4 | 2.25 | 54 |
| 2022 | 8,021,407,192 | 0.84% | 66,958,801 | 30.1 | 2.27 | 54 |
| 2021 | 7,954,448,391 | 0.86% | 67,447,099 | 29.8 | 2.29 | 53 |
| 2020 | 7,887,001,292 | 1.09% | 83,301,884 | 29.6 | 2.32 | 53 |
| 2015 | 7,470,491,872 | 1.25% | 89,751,945 | 28.3 | 2.54 | 50 |
| 2010 | 7,021,732,148 | 1.29% | 86,952,403 | 27.2 | 2.6 | 47 |
| 2005 | 6,586,970,132 | 1.31% | 83,053,428 | 26.1 | 2.63 | 44 |
| 2000 | 6,171,702,993 | 1.39% | 82,564,802 | 25.1 | 2.75 | 41 |
| 1995 | 5,758,878,982 | 1.57% | 86,215,174 | 24 | 2.89 | 39 |
| 1990 | 5,327,803,110 | 1.82% | 91,771,929 | 22.9 | 3.31 | 36 |
| 1985 | 4,868,943,465 | 1.83% | 84,267,446 | 22 | 3.52 | 33 |
| 1980 | 4,447,606,236 | 1.79% | 75,374,192 | 21.5 | 3.74 | 30 |
| 1975 | 4,070,735,277 | 1.96% | 75,210,297 | 20.7 | 4.08 | 27 |
| 1970 | 3,694,683,794 | 2.07% | 72,030,018 | 20.3 | 4.83 | 25 |
| 1965 | 3,334,533,703 | 2.03% | 63,812,562 | 20.8 | 5.07 | 22 |
| 1960 | 3,015,470,894 | 1.93% | 55,051,420 | 21.5 | 4.7 | 20 |
| 1955 | 2,740,213,792 | 1.91% | 49,424,189 | 21.8 | 5 | 18 |
This table provides a glimpse into the historical trends of world population growth, median age, fertility rates, and population density.
5. World Population Forecast (2030-2050)
| Year (July 1) | Population | Yearly % Change | Yearly Change | Median Age | Fertility Rate | Density (P/Km²) |
|---|---|---|---|---|---|---|
| 2030 | 8,569,124,911 | 0.81% | 67,502,368 | 32 | 2.2 | 58 |
| 2035 | 8,885,210,181 | 0.73% | 63,217,054 | 33 | 2.15 | 60 |
| 2040 | 9,177,190,203 | 0.65% | 58,396,004 | 34 | 2.13 | 62 |
| 2045 | 9,439,639,668 | 0.57% | 52,489,893 | 35 | 2.12 | 63 |
| 2050 | 9,664,378,587 | 0.47% | 44,947,784 | 36.1 | 2.1 | 65 |
This table shows the projected population growth, median age, fertility rates, and population density for the years 2030 to 2050.
6. Key Population Milestones
Understanding when the world reached major population milestones helps put the current numbers into perspective.
6.1. The 8 Billion Mark (2022)
In the first half of 2022, the world population reached 8 billion people, according to the United Nations. This milestone highlights the rapid growth experienced in recent decades.
6.2. Previous Milestones
- 7 Billion: 2010
- 6 Billion: 1998
- 5 Billion: 1986
- 4 Billion: 1974
- 3 Billion: 1960
- 2 Billion: 1930
- 1 Billion: 1804
| Year | Population |
|---|---|
| 1 | 0.2 Billion |
| 1000 | 0.275 Billion |
| 1500 | 0.45 Billion |
| 1650 | 0.5 Billion |
| 1750 | 0.7 Billion |
| 1804 | 1 Billion |
| 1850 | 1.2 Billion |
| 1900 | 1.6 Billion |
| 1930 | 2 Billion |
| 1950 | 2.55 Billion |
| 1960 | 3 Billion |
| 1974 | 4 Billion |
| 1980 | 4.5 Billion |
| 1987 | 5 Billion |
| 1998 | 6 Billion |
| 2010 | 7 Billion |
| 2022 | 8 Billion |
| 2029 | 8.5 Billion |
| 2037 | 9 Billion |
| 2046 | 9.5 Billion |
| 2060 | 10 Billion |
| 2100 | 10.2 Billion |
These milestones offer valuable insights into the accelerating pace of population growth over the centuries.
7. Regional Population Distribution
The world’s population is not evenly distributed. Understanding regional population differences is crucial for addressing specific challenges and opportunities.
7.1. Population by Region (2025)
| # | Region | Population (2025) | Yearly Change | Net Change | Density (P/Km²) | Land Area (Km²) | Migrants (net) | Fert. Rate | Median Age | Urban Pop % | World Share |
|---|---|---|---|---|---|---|---|---|---|---|---|
| 1 | Asia | 4,835,320,060 | 0.59% | 28,422,053 | 156 | 31,033,131 | -2,389,647 | 1.87 | 32.5 | 53.6% | 58.74% |
| 2 | Africa | 1,549,867,579 | 2.29% | 34,726,730 | 52 | 29,648,481 | -377,785 | 3.95 | 19.3 | 45% | 18.83% |
| 3 | Europe | 744,398,832 | -0.09% | -684,992 | 34 | 22,134,900 | 1,478,090 | 1.41 | 42.8 | 75.9% | 9.04% |
| 4 | Latin America and the Caribbean | 667,888,552 | 0.67% | 4,422,480 | 33 | 20,139,378 | -406,036 | 1.78 | 31.7 | 85.5% | 8.11% |
| 5 | Northern America | 387,528,403 | 0.58% | 2,233,298 | 21 | 18,651,660 | 1,556,592 | 1.59 | 38.7 | 82.5% | 4.71% |
| 6 | Oceania | 46,609,644 | 1.13% | 520,928 | 5 | 8,486,460 | 140,121 | 2.13 | 33.4 | 66.2% | 0.57% |
This table highlights the population distribution across different regions, along with their respective growth rates, densities, and other demographic indicators.
7.2. Factors Influencing Regional Distribution
Several factors influence population distribution, including:
- Economic opportunities
- Climate and geography
- Political stability
- Access to resources
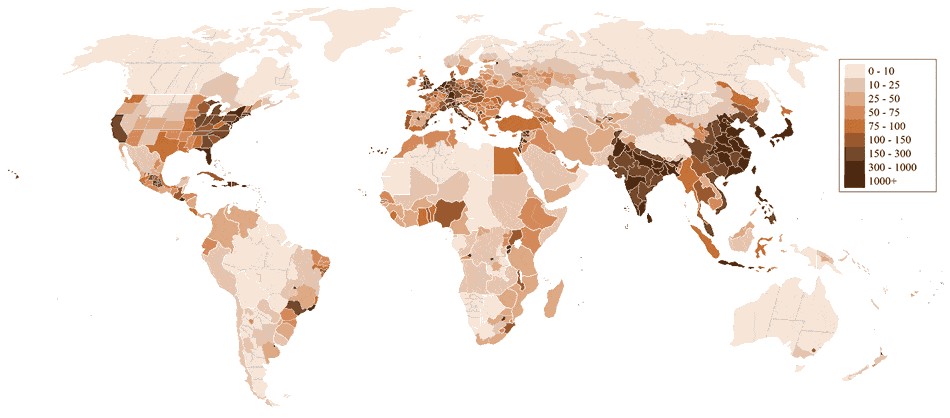
8. Population Density
Population density, measured as the number of people per square kilometer, varies significantly across the globe.
8.1. High-Density Areas
Some of the most densely populated areas include:
- Asia (e.g., Bangladesh, India)
- Europe (e.g., Netherlands, Belgium)
- Major urban centers worldwide
8.2. Low-Density Areas
Sparsely populated areas often include:
- Deserts (e.g., Sahara, Arabian)
- Arctic regions (e.g., Greenland, Siberia)
- Rainforests (e.g., Amazon, Congo)
Understanding population density is crucial for urban planning, resource allocation, and environmental management.
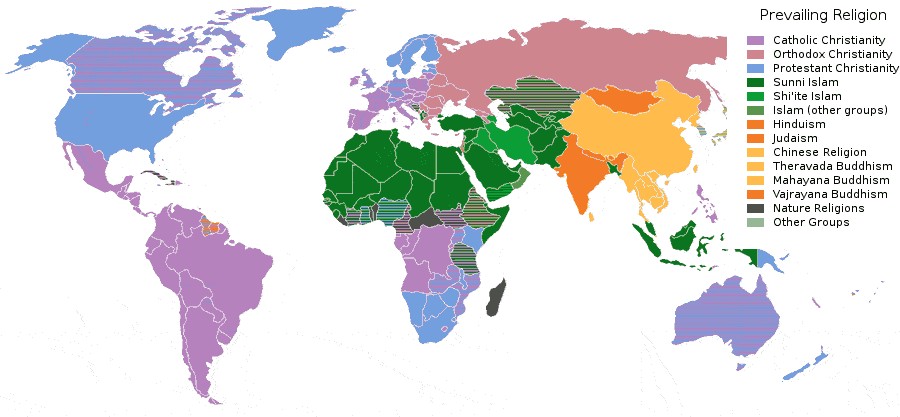
9. Population by Religion
Religious affiliation is another important aspect of understanding global population dynamics.
9.1. Major Religious Groups
- Christians: 2,173,180,000 (31% of world population)
- Muslims: 1,598,510,000 (23%)
- No Religion: 1,126,500,000 (16%)
- Hindus: 1,033,080,000 (15%)
- Buddhists: 487,540,000 (7%)
- Folk Religionists: 405,120,000 (6%)
- Other Religions: 58,110,000 (1%)
- Jews: 13,850,000 (0.2%)
9.2. Regional Distribution of Religions
Different religions are concentrated in different regions of the world. For example, Hinduism is predominantly found in India, while Islam is prevalent in the Middle East and North Africa.
10. Population by Country
Understanding the population of individual countries provides a more granular view of global demographics.
10.1. Most Populous Countries (2025)
| # | Country | Population (2025) | Yearly Change | Net Change | Density (P/Km²) | Land Area (Km²) | Migrants (net) | Fert. Rate | Median Age | Urban Pop % | World Share |
|---|---|---|---|---|---|---|---|---|---|---|---|
| 1 | India | 1,463,865,525 | 0.89% | 12,929,734 | 492 | 2,973,190 | -495,753 | 1.94 | 28.8 | 37.1% | 17.78% |
| 2 | China | 1,416,096,094 | -0.23% | -3,225,184 | 151 | 9,388,211 | -268,126 | 1.02 | 40.1 | 67.5% | 17.20% |
| 3 | United States | 347,275,807 | 0.54% | 1,849,236 | 38 | 9,147,420 | 1,230,663 | 1.62 | 38.5 | 82.8% | 4.22% |
| 4 | Indonesia | 285,721,236 | 0.79% | 2,233,305 | 158 | 1,811,570 | -39,509 | 2.1 | 30.4 | 59.6% | 3.47% |
| 5 | Pakistan | 255,219,554 | 1.57% | 3,950,390 | 331 | 770,880 | -1,235,336 | 3.5 | 20.6 | 34.4% | 3.10% |
| 6 | Nigeria | 237,527,782 | 2.08% | 4,848,304 | 261 | 910,770 | -15,258 | 4.3 | 18.1 | 54.9% | 2.89% |
| 7 | Brazil | 212,812,405 | 0.38% | 813,832 | 25 | 8,358,140 | -217,283 | 1.6 | 34.8 | 91.4% | 2.59% |
| 8 | Bangladesh | 175,686,899 | 1.22% | 2,124,535 | 1,350 | 130,170 | -402,100 | 2.11 | 26 | 42.6% | 2.13% |
| 9 | Russia | 143,997,393 | -0.57% | -823,030 | 9 | 16,376,870 | -251,822 | 1.47 | 40.3 | 75% | 1.75% |
| 10 | Ethiopia | 135,472,051 | 2.58% | 3,412,284 | 135 | 1,000,000 | 24,054 | 3.81 | 19.1 | 22.5% | 1.65% |
This table provides a snapshot of the most populous countries and their demographic characteristics.
10.2. Factors Affecting Country-Level Population
Several factors influence a country’s population, including:
- Birth rates and death rates
- Migration patterns
- Government policies
- Economic conditions
11. Estimating the Number of People Who Have Ever Lived
Estimating the total number of people who have ever lived is a challenging but fascinating endeavor.
11.1. Methodologies
Estimates typically start from around 50,000 B.C., when modern Homo sapiens appeared. They involve:
- Estimating historical population sizes
- Applying growth rates to different periods
- Accounting for variations in life expectancy
11.2. Estimates
Estimates range from 45 billion to 125 billion, with most falling in the range of 90 to 110 billion humans. This means that the current world population represents a small fraction (around 6%) of all people who have ever lived.
Do you find these figures mind-boggling? What other questions do you have about human history and population? Ask them on WHAT.EDU.VN and get free answers.
12. Accuracy of Worldometer’s Population Clock
The world population clock on Worldometer is based on data from the United Nations and the U.S. Census Bureau.
12.1. Data Sources
- United Nations: Provides comprehensive demographic data and projections.
- U.S. Census Bureau: Offers detailed population estimates and analyses.
12.2. Ensuring Accuracy
Worldometer’s population clock is designed to show the same number regardless of the visitor’s location or computer time. This ensures consistency and accuracy in the displayed information.
13. Convenience and Ease of Use on WHAT.EDU.VN
At WHAT.EDU.VN, we understand that finding reliable information can be challenging. That’s why we’ve created a platform where you can ask any question and receive free answers from experts.
13.1. Overcoming Challenges in Information Retrieval
- Quick and Free Answers: No more endless searches or expensive consultations.
- Knowledgeable Community: Get answers from people with expertise in various fields.
- Easy-to-Understand Information: Complex topics explained in simple terms.
13.2. Call to Action
Have more questions about Earth’s population or any other topic? Visit WHAT.EDU.VN today and experience the ease and convenience of getting free, expert advice. Our community is ready to help you find the answers you need.
Contact Us:
- Address: 888 Question City Plaza, Seattle, WA 98101, United States
- WhatsApp: +1 (206) 555-7890
- Website: WHAT.EDU.VN
14. Frequently Asked Questions (FAQs) about Earth’s Population
Here are some common questions people have about the Earth’s population.
| Question | Answer |
|---|---|
| What is the current world population? | The current world population is estimated to be over 8 billion people. |
| How fast is the world population growing? | The world population is currently growing at a rate of approximately 0.85% per year, which translates to around 70 million people annually. |
| When is the world population expected to reach 9 billion? | The world population is expected to reach 9 billion around 2037. |
| What is the projected world population in 2050? | The projected world population in 2050 is around 9.6 billion. |
| Which region is growing the fastest? | Africa is currently the fastest-growing region in the world. |
| What are the main factors affecting population growth? | Factors affecting population growth include birth rates, death rates, access to family planning, education levels, economic development, and government policies. |
| How many people have ever lived on Earth? | Estimates range from 90 to 110 billion people. |
| What is population density? | Population density is the number of people per square kilometer. |
| Which countries have the largest populations? | As of 2025, the countries with the largest populations are India and China. |
| Where can I find reliable information about world population statistics? | You can find reliable information about world population statistics on websites like WHAT.EDU.VN, the United Nations Population Division, and the U.S. Census Bureau. Looking for more than just stats? At WHAT.EDU.VN you can connect with human experts. Ask anything! |
15. What Makes WHAT.EDU.VN Stand Out?
15.1. Expertise and Trustworthiness
WHAT.EDU.VN is committed to providing accurate and up-to-date information. Our content is based on reputable sources and reviewed by experts. We adhere to the highest standards of E-E-A-T (Expertise, Experience, Authoritativeness, and Trustworthiness) and YMYL (Your Money or Your Life) guidelines to ensure the reliability of our information.
15.2. Community and Support
We believe in the power of community. WHAT.EDU.VN is more than just a website; it’s a platform where people can connect, share knowledge, and support each other. Whether you’re a student, a professional, or simply someone with a curious mind, you’ll find a welcoming community ready to help you on your quest for knowledge.
Do you have questions about anything and everything? Don’t hesitate to ask on what.edu.vn. We are here to provide free answers and expert guidance.