Before diving in, let’s clarify what quartiles are. Quartiles divide a dataset of numerical values into four equal parts. The three quartiles are Q1 (the first quartile or lower quartile), Q2 (the second quartile, which is the median), and Q3 (the third quartile or upper quartile). This guide focuses on the interquartile range, a key concept derived from these quartiles.
Understanding Range in Statistics
In statistics, the range is a basic measure of dispersion. It’s simply the difference between the highest and lowest values in a dataset. While easy to calculate, it’s sensitive to outliers and doesn’t provide a complete picture of data spread.
The formula is:
Range = Xmax – Xmin
Where Xmax represents the largest value and Xmin represents the smallest value in the dataset.
Interquartile Range: A Detailed Definition
The interquartile range (IQR) represents the range of the middle 50% of the data. It’s the difference between the third quartile (Q3) and the first quartile (Q1). In simpler terms, it tells you how spread out the data is around the median. The IQR is less sensitive to outliers than the range, making it a more robust measure of spread.
The Interquartile Range Formula
The interquartile range is calculated using the following formula:
Interquartile range = Upper Quartile – Lower Quartile = Q3 – Q1
Where Q1 is the first quartile and Q3 is the third quartile of the data set.
 Interquartile range
Understanding the Interquartile Range: This image visually represents how the interquartile range (IQR) captures the spread of the middle 50% of a dataset, bounded by the first quartile (Q1) and the third quartile (Q3).
Semi-Interquartile Range
The semi-interquartile range is half of the interquartile range. It provides a measure of the average distance of the first and third quartiles from the median.
The formula is:
Semi Interquartile Range = (Q3 – Q1) / 2
The Role of Median and Interquartile Range
The median represents the midpoint of a dataset. The interquartile range (IQR) measures the spread of the data around the median. When a dataset is skewed (not symmetrical), the median is often a better measure of central tendency than the mean, and the IQR is a more appropriate measure of variability than the standard deviation.
Here’s a quick recap:
- Q1 – Lower Quartile (25th percentile)
- Q2 – Median (50th percentile)
- Q3 – Upper Quartile (75th percentile)
The quartile deviation, calculated by dividing the interquartile range by 2, is also known as the semi-interquartile range.
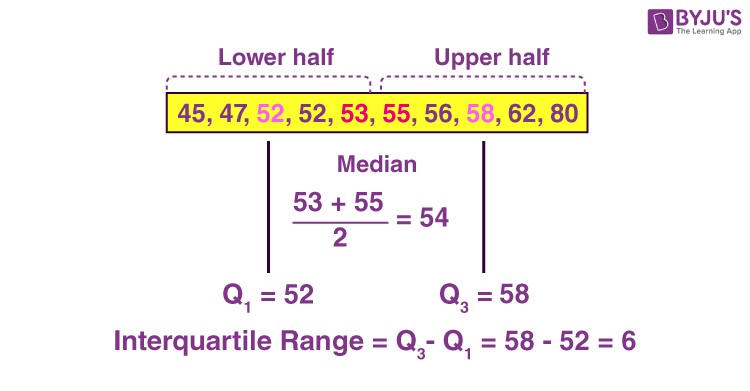
How to Calculate the Interquartile Range: A Step-by-Step Guide
Follow these steps to calculate the interquartile range:
- Order the data: Arrange the dataset in ascending order (from smallest to largest).
- Find the median (Q2): Determine the median of the dataset. If there’s an odd number of values, the median is the middle value. If there’s an even number of values, the median is the average of the two middle values.
- Find Q1: Q1 is the median of the lower half of the data (excluding the median if the dataset has an odd number of values).
- Find Q3: Q3 is the median of the upper half of the data (excluding the median if the dataset has an odd number of values).
- Calculate the IQR: Subtract Q1 from Q3 (IQR = Q3 – Q1).
Interquartile Range Example: A Practical Application
Problem:
Calculate the interquartile range for the following dataset representing the ages of participants in a study: 18, 20, 22, 24, 26, 28, 30, 32, 34, 36.
Solution:
- Ordered data: The data is already in ascending order: 18, 20, 22, 24, 26, 28, 30, 32, 34, 36.
- Find Q2: There are 10 values (even number), so the median (Q2) is the average of the 5th and 6th values: (26 + 28) / 2 = 27.
- Find Q1: The lower half is: 18, 20, 22, 24, 26. The median of this lower half is 22. Therefore, Q1 = 22.
- Find Q3: The upper half is: 28, 30, 32, 34, 36. The median of this upper half is 32. Therefore, Q3 = 32.
- Calculate the IQR: IQR = Q3 – Q1 = 32 – 22 = 10.
Therefore, the interquartile range for this dataset is 10.
Conclusion
The interquartile range is a valuable tool for understanding the spread of data, especially when dealing with skewed distributions or datasets containing outliers. By focusing on the middle 50% of the data, the IQR provides a robust measure of variability, complementing other statistical measures like the range and standard deviation. Understanding and calculating the IQR is essential for data analysis and informed decision-making.