KPI, or Key Performance Indicator, is a crucial metric for measuring success. At WHAT.EDU.VN, we break down the complexities of performance indicators and offer free answers to your burning questions. Explore performance measurement, success metrics, and goal tracking with us.
1. What Is KPI and Why Does It Matter?
Key Performance Indicators (KPIs) are measurable values that demonstrate how effectively a company is achieving key business objectives. Organizations use KPIs at multiple levels to evaluate their success at reaching targets. High-level KPIs may focus on the overall performance of the enterprise, while low-level KPIs may focus on processes in departments such as sales, marketing, or customer support.
KPIs are essential because they provide a clear, data-driven way to track progress towards strategic goals. They help businesses understand what’s working and what’s not, allowing them to make informed decisions and adjustments to improve performance. By monitoring KPIs, companies can identify trends, anticipate problems, and seize opportunities, ultimately leading to greater success.
Wondering how KPIs can revolutionize your business strategy? Head over to WHAT.EDU.VN and ask our experts. It’s free and easy.
2. Defining Key Performance Indicators: A Detailed Explanation
2.1. Understanding the Core Components
A KPI is more than just a metric; it is a carefully chosen indicator that reflects a critical aspect of an organization’s performance. To truly understand what a KPI is, it’s important to break down its core components:
- Measurable: A KPI must be quantifiable. This means it can be expressed as a number, percentage, ratio, or other objective unit. This allows for consistent tracking and comparison over time.
- Relevant: A KPI should directly relate to a specific business goal or objective. It should measure something that is important to the organization’s success.
- Achievable: While KPIs should be ambitious, they should also be realistic and attainable. Setting unattainable KPIs can demotivate employees and lead to frustration.
- Time-bound: Every KPI should have a specific timeframe associated with it. This could be a month, quarter, year, or other relevant period. This allows for tracking progress and measuring performance against targets.
2.2. Qualitative vs. Quantitative KPIs
KPIs can be broadly categorized into two types: qualitative and quantitative.
- Quantitative KPIs: These are metrics that can be measured numerically. Examples include revenue growth, customer acquisition cost, and website traffic. Quantitative KPIs are generally easier to track and analyze.
- Qualitative KPIs: These are metrics that are more subjective and difficult to measure numerically. Examples include customer satisfaction, brand perception, and employee morale. Qualitative KPIs are often measured through surveys, interviews, and focus groups.
2.3. Leading vs. Lagging Indicators
KPIs can also be classified as leading or lagging indicators.
- Leading Indicators: These are predictive metrics that can be used to forecast future performance. For example, the number of sales leads generated is a leading indicator of future revenue.
- Lagging Indicators: These are metrics that measure past performance. For example, revenue growth is a lagging indicator that reflects the results of past sales efforts.
Understanding the difference between leading and lagging indicators is crucial for effective KPI management. Leading indicators can help you proactively identify and address potential problems, while lagging indicators provide a historical perspective on performance.
Need help identifying the right KPIs for your business? Visit WHAT.EDU.VN and get free expert advice.
3. The KPI Selection Process: Choosing the Right Metrics
3.1. Aligning KPIs with Business Objectives
The first step in selecting KPIs is to clearly define your business objectives. What are you trying to achieve? What are your strategic goals? Once you have a clear understanding of your objectives, you can identify the metrics that are most relevant to measuring progress towards those goals.
For example, if your objective is to increase market share, relevant KPIs might include:
- Market share percentage: This directly measures your share of the overall market.
- Customer acquisition cost: This measures the cost of acquiring new customers, which is important for profitable growth.
- Customer satisfaction: Satisfied customers are more likely to remain loyal and recommend your products or services to others, contributing to increased market share.
3.2. SMART Criteria for KPI Selection
The SMART criteria provide a useful framework for selecting effective KPIs. SMART stands for:
- Specific: The KPI should be clearly defined and focused.
- Measurable: The KPI should be quantifiable and easy to track.
- Achievable: The KPI should be realistic and attainable.
- Relevant: The KPI should be directly related to a specific business objective.
- Time-bound: The KPI should have a specific timeframe associated with it.
By applying the SMART criteria, you can ensure that your KPIs are well-defined, meaningful, and actionable.
3.3. Involving Stakeholders in the Selection Process
It’s important to involve stakeholders from different departments and levels of the organization in the KPI selection process. This helps to ensure that the KPIs are relevant to everyone’s needs and that everyone is aligned on the goals and objectives.
Stakeholder involvement can also help to identify potential unintended consequences of focusing on certain KPIs. For example, focusing solely on sales volume might lead to a decline in customer service quality.
Don’t know where to start with KPI selection? Ask the experts at WHAT.EDU.VN for personalized guidance, absolutely free.
4. Examples of KPIs Across Different Departments
Key Performance Indicators vary widely depending on the department and industry. Here are some common KPI examples categorized by department:
4.1. Financial KPIs
Financial KPIs are used to measure the financial performance of an organization. They provide insights into profitability, liquidity, and solvency.
- Gross Profit Margin: (Revenue – Cost of Goods Sold) / Revenue. This measures the profitability of a company’s core business operations.
- Net Profit Margin: Net Profit / Revenue. This measures the overall profitability of a company after all expenses have been deducted.
- Operating Expense Ratio: Operating Expenses / Revenue. This measures the efficiency of a company’s operations.
- Working Capital Ratio: Current Assets / Current Liabilities. This measures a company’s ability to meet its short-term obligations.
4.2. Sales KPIs
Sales KPIs are used to measure the effectiveness of a company’s sales efforts. They provide insights into sales performance, lead generation, and customer acquisition.
- New Inbound Leads: The number of new leads generated through inbound marketing efforts.
- New Qualified Opportunities: The number of leads that have been qualified as potential sales opportunities.
- Total Pipeline Value: The total value of all sales opportunities in the pipeline.
- Sales Volume by Location: The amount of sales generated in different geographic locations.
- Average Order Value: The average value of each sales order.
4.3. Marketing KPIs
Marketing KPIs are used to measure the effectiveness of a company’s marketing campaigns. They provide insights into brand awareness, lead generation, and customer engagement.
- Marketing Qualified Leads (MQLs): Leads that have been identified as having a high potential to become customers based on their engagement with marketing materials.
- Sales Qualified Leads (SQLs): Leads that have been further qualified by the sales team as being ready for a sales conversation.
- Conversion Rates: The percentage of leads that convert into customers. This can be tracked for specific goals, such as website conversions, lead form submissions, or sales calls.
- Social Program ROI: The return on investment for social media marketing programs. This can be measured by tracking website traffic, lead generation, and sales conversions.
- Return on Ad Spend (ROAS): The amount of revenue generated for every dollar spent on advertising.
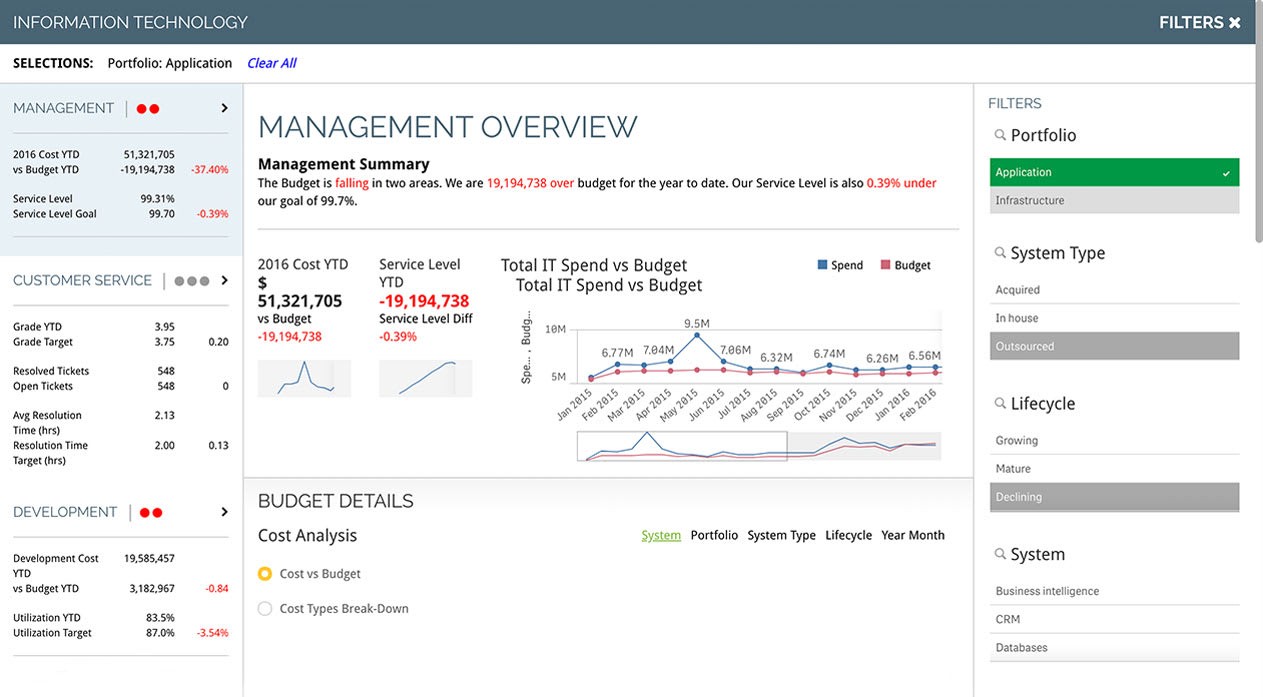
4.4. IT KPIs
IT KPIs are used to measure the performance of a company’s IT infrastructure and services. They provide insights into system uptime, security, and cost efficiency.
- Total Support Tickets: The total number of support tickets received.
- Open Support Tickets: The number of support tickets that are currently open.
- Ticket Resolution Time: The average time it takes to resolve a support ticket.
- Security Related Downtime: The amount of time that systems are unavailable due to security incidents.
- IT Costs vs. Revenue: The ratio of IT costs to overall revenue.
- Reopened Tickets: The number of support tickets that are reopened after being initially resolved.
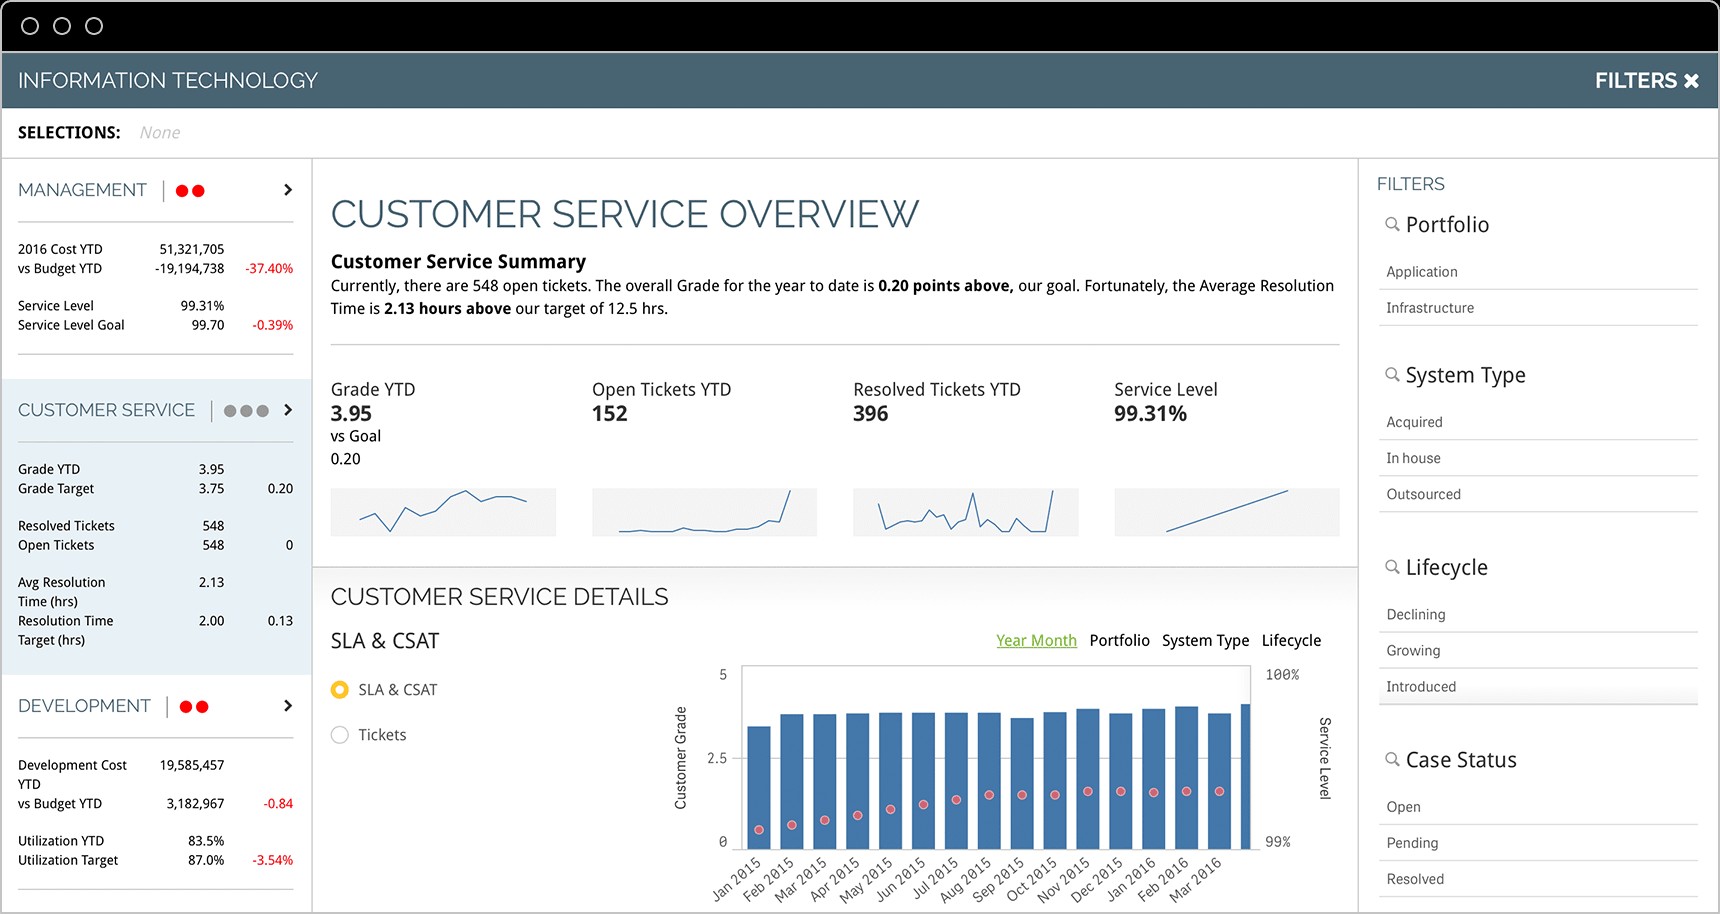
4.5. Customer Service KPIs
Customer service KPIs are used to measure the quality of a company’s customer service. They provide insights into customer satisfaction, response times, and resolution rates.
- First Contact Resolution Rate: The percentage of customer issues that are resolved on the first contact.
- Average Response Time: The average time it takes to respond to customer inquiries.
- Most Active Support Agents: The support agents who are handling the most customer interactions.
- Cost Per Conversation: The average cost of each customer interaction.
- Customer Effort Score: A measure of the effort that customers have to expend to resolve their issues.
Want more examples of KPIs tailored to your specific industry? Ask our experts at WHAT.EDU.VN. We’re here to help, and it’s always free.
5. How to Track and Monitor KPIs
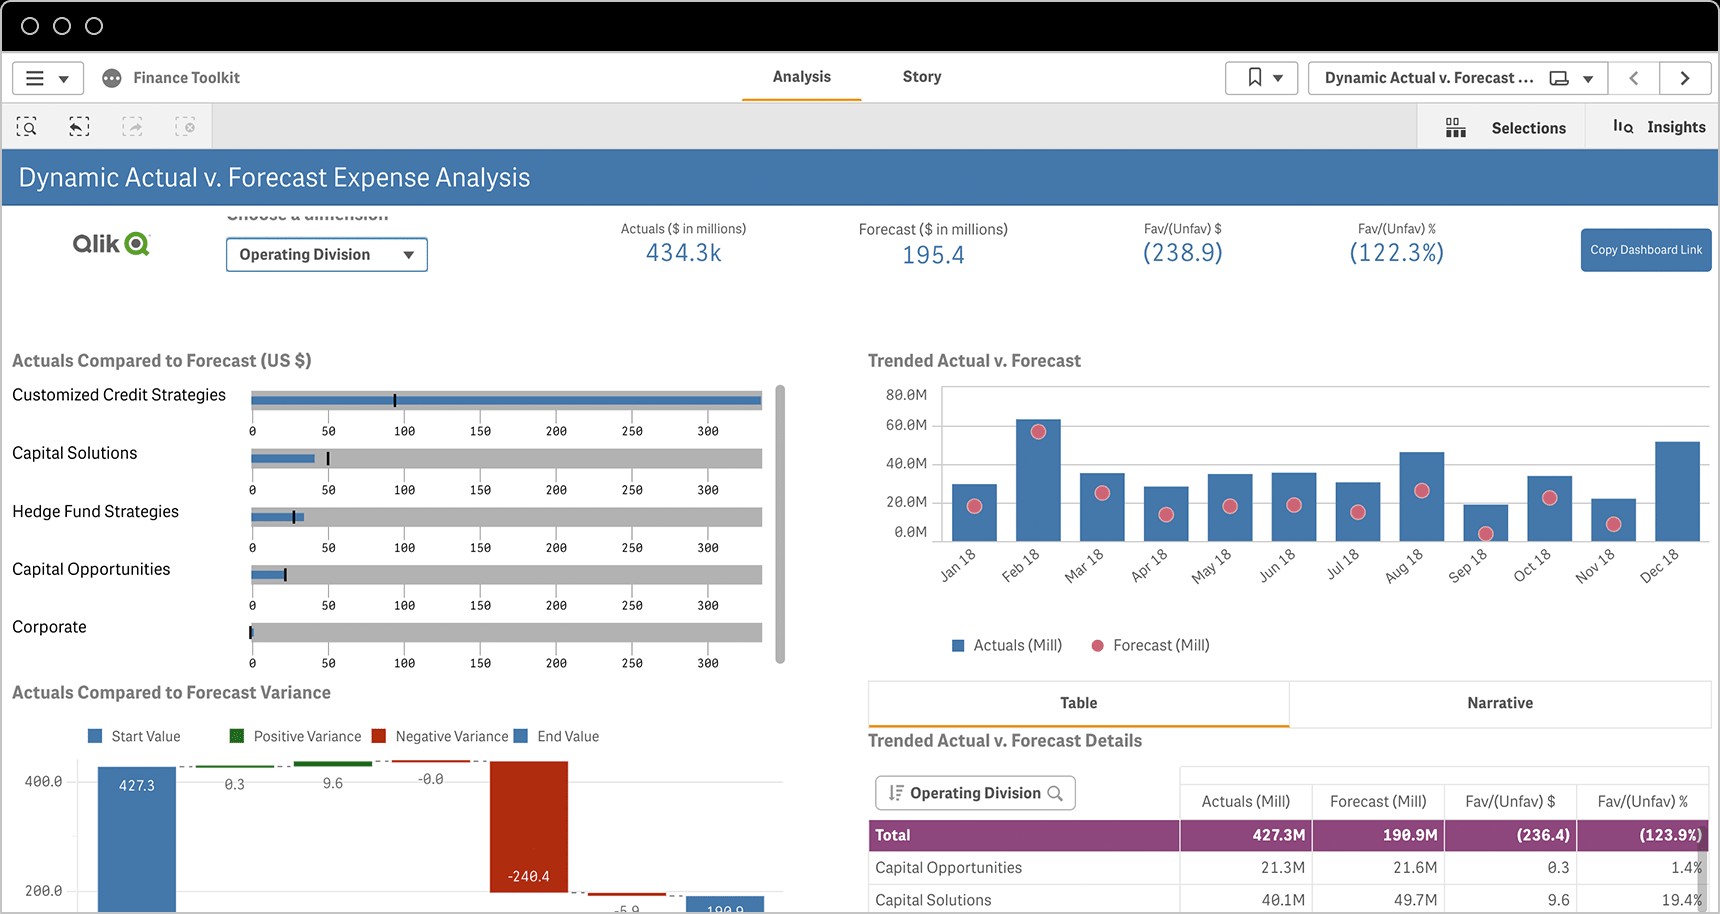
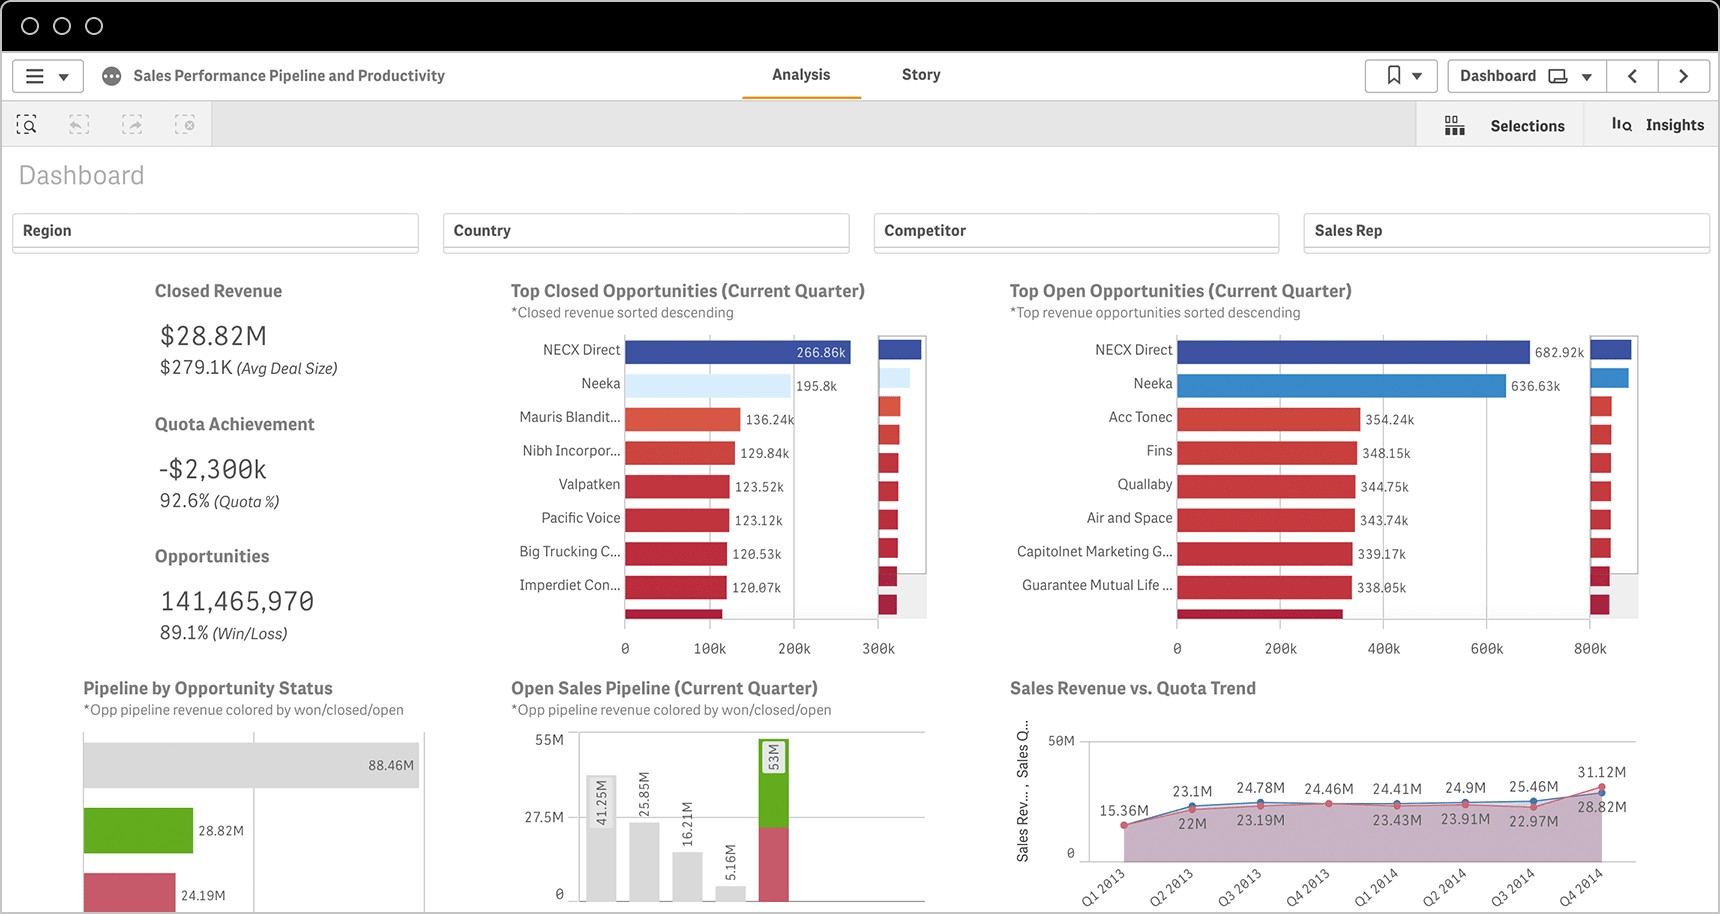
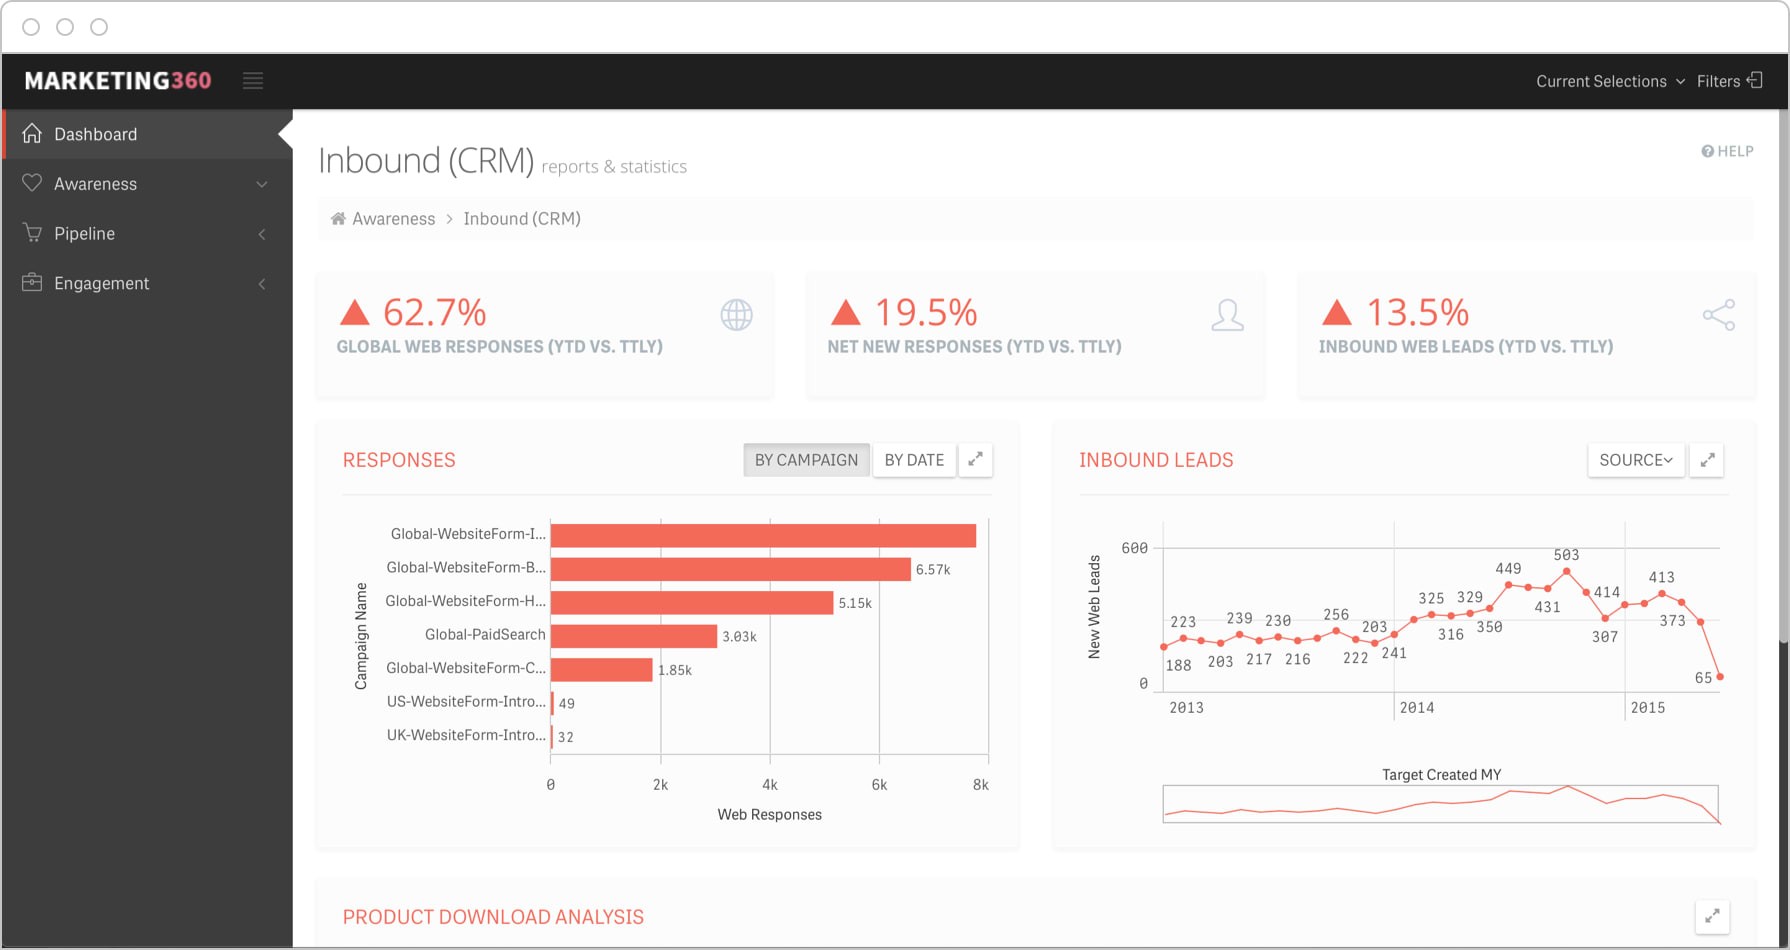
5.1. KPI Dashboards and Reporting Tools
KPI dashboards are visual displays that provide a snapshot of key performance indicators. They allow users to quickly and easily track progress towards goals and identify areas that need attention. Reporting tools can be used to generate detailed reports on KPI performance over time.
Popular KPI dashboard and reporting tools include:
- Tableau: A powerful data visualization and business intelligence platform.
- Power BI: A business analytics service from Microsoft that provides interactive visualizations and business intelligence capabilities.
- Google Data Studio: A free data visualization tool that allows you to create interactive dashboards and reports.
- Klipfolio: A cloud-based dashboard platform that allows you to connect to various data sources and create custom dashboards.
5.2. Setting Up Regular KPI Reviews
Regular KPI reviews are essential for ensuring that KPIs are being tracked effectively and that progress is being made towards goals. These reviews should involve stakeholders from different departments and levels of the organization.
During KPI reviews, it’s important to:
- Review KPI performance: Analyze the data and identify any trends or patterns.
- Identify areas for improvement: Determine what actions can be taken to improve KPI performance.
- Adjust KPIs as needed: Make changes to KPIs if they are no longer relevant or if they are not driving the desired behavior.
5.3. Using Data Visualization to Communicate KPI Performance
Data visualization is a powerful tool for communicating KPI performance. Charts, graphs, and other visual aids can help to make complex data easier to understand and interpret.
When creating data visualizations, it’s important to:
- Choose the right chart type: Select a chart type that is appropriate for the data being presented.
- Keep it simple: Avoid clutter and focus on the key information.
- Use clear labels and titles: Make sure that the chart is easy to understand.
- Highlight key trends and patterns: Draw attention to the most important insights.
Struggling to visualize your KPI data? Get free advice from the experts at WHAT.EDU.VN and turn your data into actionable insights.
6. Common Mistakes to Avoid When Using KPIs
6.1. Setting Too Many KPIs
Setting too many KPIs can be overwhelming and can dilute focus. It’s important to prioritize the most important metrics and to avoid tracking too many unnecessary KPIs. A good rule of thumb is to focus on no more than 5-7 KPIs per department.
6.2. Not Regularly Reviewing KPIs
KPIs should be reviewed regularly to ensure that they are still relevant and that progress is being made towards goals. Neglecting to review KPIs can lead to missed opportunities and wasted resources.
6.3. Failing to Align KPIs with Business Objectives
KPIs should be directly aligned with business objectives. Tracking KPIs that are not aligned with strategic goals can lead to confusion and a lack of focus.
6.4. Focusing Solely on Lagging Indicators
While lagging indicators are important for measuring past performance, it’s also important to track leading indicators that can be used to forecast future performance. Focusing solely on lagging indicators can make it difficult to proactively address potential problems.
6.5. Ignoring Qualitative Data
While quantitative data is important for tracking progress, it’s also important to consider qualitative data, such as customer feedback and employee morale. Ignoring qualitative data can lead to a narrow and incomplete view of performance.
Avoid these common KPI mistakes and unlock your business’s full potential. If you need clarification on how to avoid these mistakes reach out to WHAT.EDU.VN. It’s fast, free, and always helpful.
7. The Future of KPIs: Trends and Innovations
7.1. AI and Machine Learning in KPI Management
Artificial intelligence (AI) and machine learning (ML) are increasingly being used to automate KPI management processes, such as data collection, analysis, and reporting. AI and ML can also be used to identify patterns and anomalies in KPI data, providing valuable insights that can be used to improve performance.
7.2. Predictive KPIs and Forecasting
Predictive KPIs use historical data and statistical models to forecast future performance. This allows businesses to proactively identify and address potential problems before they occur.
7.3. Real-Time KPI Monitoring
Real-time KPI monitoring allows businesses to track performance in real-time, providing immediate feedback on the impact of their actions. This allows for faster decision-making and more agile responses to changing market conditions.
7.4. Integrating KPIs with Business Intelligence (BI) Systems
Integrating KPIs with BI systems allows businesses to combine KPI data with other business data, providing a more comprehensive view of performance. This can help to identify hidden relationships and insights that would not be apparent from looking at KPI data alone.
The future of KPIs is bright, with new technologies and innovations constantly emerging. Stay ahead of the curve by continuously learning and adapting your KPI management practices.
8. Case Studies: Successful KPI Implementation
8.1. Case Study 1: Improving Customer Satisfaction with KPIs
A telecommunications company implemented a set of customer service KPIs, including first contact resolution rate, average response time, and customer satisfaction score. By tracking these KPIs, the company was able to identify areas where its customer service was lacking and implement improvements. As a result, customer satisfaction scores increased by 15% within six months.
8.2. Case Study 2: Boosting Sales Performance with KPIs
A software company implemented a set of sales KPIs, including new leads generated, qualified opportunities, and sales conversion rate. By tracking these KPIs, the company was able to identify its most effective sales strategies and allocate resources accordingly. As a result, sales revenue increased by 20% within one year.
8.3. Case Study 3: Enhancing Operational Efficiency with KPIs
A manufacturing company implemented a set of operational KPIs, including production uptime, defect rate, and inventory turnover. By tracking these KPIs, the company was able to identify bottlenecks in its production process and implement improvements. As a result, production efficiency increased by 10% within three months.
These case studies demonstrate the power of KPIs to drive significant improvements in business performance. By carefully selecting and tracking the right KPIs, companies can gain valuable insights into their operations and make informed decisions that lead to greater success.
Want to share your own KPI success story? Connect with the community at WHAT.EDU.VN and inspire others with your achievements.
9. Frequently Asked Questions (FAQs) about KPIs
| Question | Answer |
|---|---|
| What is the difference between a KPI and a metric? | A metric is any quantifiable measure, while a KPI is a specific type of metric that is critical to achieving a business objective. Not all metrics are KPIs, but all KPIs are metrics. |
| How often should KPIs be reviewed? | KPIs should be reviewed regularly, at least monthly or quarterly, to ensure that they are still relevant and that progress is being made towards goals. |
| How many KPIs should I track? | It’s important to prioritize the most important metrics and to avoid tracking too many unnecessary KPIs. A good rule of thumb is to focus on no more than 5-7 KPIs per department. |
| What is the best way to present KPI data? | Data visualization is a powerful tool for communicating KPI performance. Charts, graphs, and other visual aids can help to make complex data easier to understand and interpret. |
| How can I ensure that my KPIs are aligned with my business objectives? | The first step in selecting KPIs is to clearly define your business objectives. Once you have a clear understanding of your objectives, you can identify the metrics that are most relevant to measuring progress towards those goals. |
| What are some common KPI mistakes to avoid? | Common KPI mistakes include setting too many KPIs, not regularly reviewing KPIs, failing to align KPIs with business objectives, focusing solely on lagging indicators, and ignoring qualitative data. |
| How can AI and machine learning be used in KPI management? | AI and ML can be used to automate KPI management processes, such as data collection, analysis, and reporting. They can also be used to identify patterns and anomalies in KPI data, providing valuable insights that can be used to improve performance. |
| What are predictive KPIs? | Predictive KPIs use historical data and statistical models to forecast future performance. This allows businesses to proactively identify and address potential problems before they occur. |
| How can I integrate KPIs with my BI system? | Integrating KPIs with BI systems allows businesses to combine KPI data with other business data, providing a more comprehensive view of performance. This can help to identify hidden relationships and insights. |
| Where can I find more information about KPIs? | WHAT.EDU.VN is a great resource for finding answers to your questions about KPIs and other business topics. Our experts are available to provide free, personalized advice. |
10. Conclusion: Unleash Your Potential With Strategic KPIs
Understanding “What Is Kpi” is fundamental to any organization striving for growth and success. By carefully selecting, tracking, and analyzing KPIs, businesses can gain valuable insights into their performance, make informed decisions, and achieve their strategic goals. Remember to align your KPIs with your overall business objectives, regularly review your metrics, and avoid common pitfalls.
Don’t let unanswered questions hold you back. Visit WHAT.EDU.VN today and ask anything! Our community of experts is ready to provide you with free, personalized advice to help you unlock your full potential.
Ready to take the next step?
Have questions about KPIs or any other topic? Visit WHAT.EDU.VN now and ask your question for free! Our team of experts is standing by to provide you with the answers you need to succeed.
Contact Us:
Address: 888 Question City Plaza, Seattle, WA 98101, United States
Whatsapp: +1 (206) 555-7890
Website: what.edu.vn