KPI in business, a Key Performance Indicator, is a measurable value that demonstrates how effectively a company is achieving key business objectives. WHAT.EDU.VN provides free access to information to help you understand and implement KPIs effectively. These performance metrics provide insights into business performance, showing where your company excels and where improvements are needed. Let’s explore key performance indicators, business objectives, and performance measurement, which are all crucial for success.
1. Defining What is KPI in Business
1.1. Understanding the Core Concept of KPI
At its heart, a KPI (Key Performance Indicator) is a quantifiable measure used to evaluate the success of an organization, employee, etc., in meeting objectives for performance. It’s a critical element in performance management and strategic planning. Think of it as a compass guiding a ship; it shows whether you’re on course to reach your destination.
1.2. Key Characteristics of Effective KPIs
Not all metrics are KPIs. Effective KPIs share several key characteristics:
- Measurable: A KPI must be quantifiable. You need to be able to assign a numerical value to it.
- Specific: It should be clearly defined and focused on a particular objective.
- Achievable: The target should be realistic and attainable.
- Relevant: It must be directly linked to the strategic goals of the organization.
- Time-bound: A timeframe for achieving the target needs to be specified.
1.3. The Role of KPIs in Strategic Planning
KPIs play a vital role in strategic planning. They help organizations:
- Set clear objectives: KPIs translate broad strategic goals into specific, measurable targets.
- Track progress: They provide a way to monitor progress towards achieving those goals.
- Make informed decisions: KPIs offer data-driven insights that inform decision-making.
- Improve performance: By identifying areas of underperformance, KPIs drive continuous improvement.
- Align efforts: They ensure that everyone in the organization is working towards the same goals.
1.4. KPI vs. Metric: Understanding the Difference
While the terms “KPI” and “metric” are often used interchangeably, there’s a subtle difference. A metric is simply a measurement. A KPI, on the other hand, is a metric that’s critical to the success of the organization. In other words, all KPIs are metrics, but not all metrics are KPIs.
1.5. Example of a KPI in Business
Consider a retail company aiming to increase sales. A relevant KPI could be “Increase online sales by 15% in the next quarter.” This KPI is measurable (15%), specific (online sales), achievable (depending on the company’s current performance and market conditions), relevant (directly contributes to the company’s overall goal of increasing sales), and time-bound (next quarter).
2. Why KPIs Matter: Benefits and Importance
2.1. Measuring Progress Towards Business Goals
The primary benefit of using KPIs is the ability to measure progress toward achieving business goals. KPIs provide a clear indication of whether your strategies are working and whether you’re on track to meet your objectives. Without KPIs, it’s difficult to objectively assess performance and make necessary adjustments.
2.2. Identifying Areas for Improvement
KPIs not only measure progress but also highlight areas where performance is lagging. By tracking KPIs, you can identify bottlenecks, inefficiencies, and other issues that are hindering your company’s success. This allows you to focus your resources on addressing these areas and improving overall performance.
2.3. Data-Driven Decision Making
KPIs provide a foundation for data-driven decision-making. Instead of relying on gut feelings or assumptions, you can use KPI data to inform your decisions and strategies. This leads to more effective and impactful choices.
2.4. Increased Accountability
When KPIs are clearly defined and communicated, they increase accountability throughout the organization. Employees understand what’s expected of them and how their performance will be measured. This promotes a sense of ownership and encourages individuals to take responsibility for their contributions.
2.5. Improved Communication and Alignment
KPIs facilitate communication and alignment across different departments and teams. By tracking the same key metrics, everyone is on the same page regarding the organization’s goals and priorities. This fosters collaboration and ensures that everyone is working towards the same objectives.
3. Types of KPIs in Business
3.1. Financial KPIs
Financial KPIs focus on the financial health and performance of the organization. They provide insights into profitability, revenue, expenses, and cash flow. Examples include:
- Revenue Growth: Measures the increase in revenue over a specific period.
- Gross Profit Margin: Indicates the profitability of a company after deducting the cost of goods sold.
- Net Profit Margin: Shows the percentage of revenue remaining after all expenses have been deducted.
- Return on Investment (ROI): Measures the profitability of an investment relative to its cost.
- Cash Flow: Tracks the movement of cash into and out of the business.
3.2. Customer KPIs
Customer KPIs focus on customer satisfaction, loyalty, and retention. They provide insights into how well the organization is meeting customer needs and expectations. Examples include:
- Customer Satisfaction Score (CSAT): Measures customer satisfaction with a product, service, or experience.
- Net Promoter Score (NPS): Gauges customer loyalty and willingness to recommend the company to others.
- Customer Retention Rate: Indicates the percentage of customers who continue to do business with the company over a specific period.
- Customer Acquisition Cost (CAC): Measures the cost of acquiring a new customer.
- Customer Lifetime Value (CLTV): Predicts the total revenue a customer will generate throughout their relationship with the company.
3.3. Operational KPIs
Operational KPIs focus on the efficiency and effectiveness of internal processes. They provide insights into how well the organization is managing its resources and operations. Examples include:
- Production Costs: Measures the cost of producing goods or services.
- Inventory Turnover: Indicates how quickly inventory is sold and replaced.
- Order Fulfillment Time: Measures the time it takes to process and fulfill customer orders.
- Defect Rate: Tracks the percentage of products or services that have defects.
- Employee Turnover: Measures the rate at which employees leave the organization.
3.4. Marketing KPIs
Marketing KPIs focus on the effectiveness of marketing campaigns and initiatives. They provide insights into lead generation, brand awareness, and return on marketing investment. Examples include:
- Website Traffic: Measures the number of visitors to a website.
- Conversion Rate: Indicates the percentage of website visitors who complete a desired action, such as making a purchase or filling out a form.
- Cost Per Lead (CPL): Measures the cost of generating a new lead.
- Click-Through Rate (CTR): Indicates the percentage of people who click on a link or advertisement.
- Social Media Engagement: Measures the level of interaction and engagement with social media content.
3.5. Employee KPIs
Employee KPIs focus on employee performance, productivity, and engagement. They provide insights into how well employees are contributing to the organization’s goals. Examples include:
- Employee Productivity: Measures the output of employees over a specific period.
- Absenteeism Rate: Tracks the percentage of time employees are absent from work.
- Training Hours: Measures the amount of time employees spend in training and development activities.
- Employee Satisfaction: Gauges employee satisfaction with their job and the work environment.
- Performance Goals Achieved: Tracks the percentage of employees who achieve their performance goals.
4. Examples of KPIs by Department
4.1. Finance KPIs
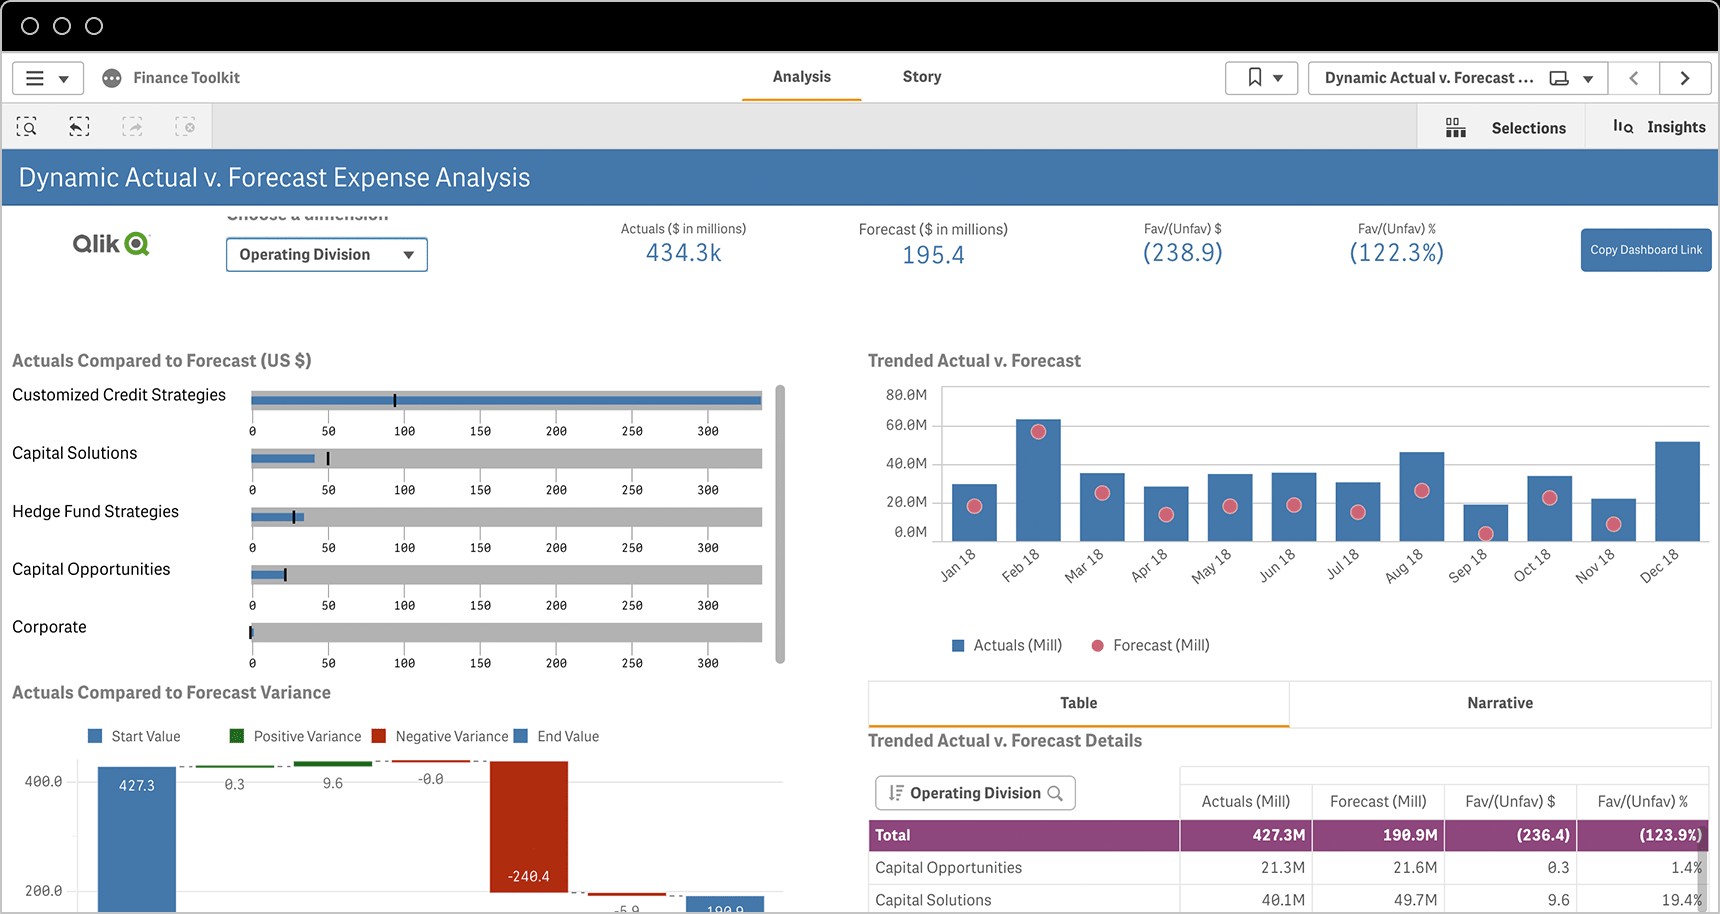
Finance managers track various financial metrics to ensure the company’s financial health. Examples include:
- Gross Profit Margin (and %): This KPI shows the percentage of revenue remaining after deducting the cost of goods sold. A higher margin indicates better profitability.
- Operating Profit Margin (and %): This KPI reflects the profitability of the company’s core operations, excluding interest and taxes.
- Net Profit Margin (and %): This KPI shows the percentage of revenue remaining after all expenses, including interest and taxes, have been deducted.
- Operating Expense Ratio: This KPI measures the percentage of revenue used to cover operating expenses. A lower ratio indicates greater efficiency.
- Working Capital Ratio: This KPI assesses the company’s ability to meet its short-term obligations. A ratio above 1 indicates that the company has more current assets than current liabilities.
Alt text: Financial dashboard displaying actual vs forecast expenses, tracking budget variance.
4.2. Sales KPIs
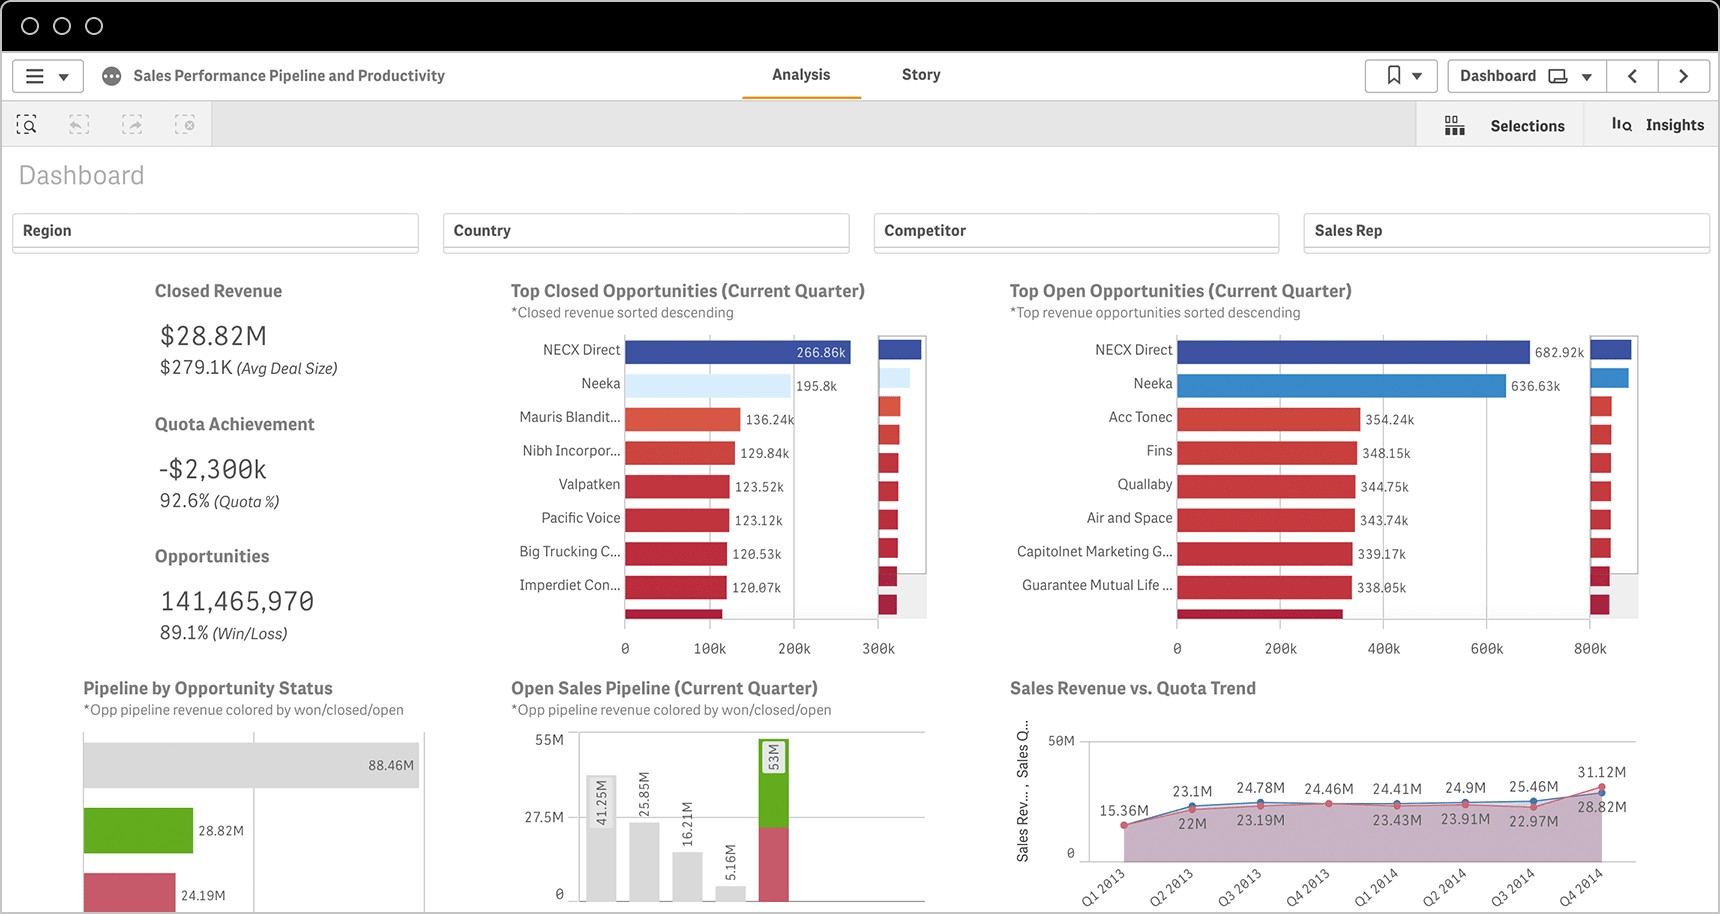
Sales teams use KPIs to track their progress towards meeting sales targets. Examples include:
- New Inbound Leads: This KPI measures the number of new leads generated through inbound marketing efforts.
- New Qualified Opportunities: This KPI tracks the number of leads that have been qualified as potential customers.
- Total Pipeline Value: This KPI represents the total value of all potential sales opportunities in the pipeline.
- Sales Volume by Location: This KPI tracks sales performance in different geographic locations.
- Average Order Value: This KPI measures the average amount spent per order.
Alt text: Executive sales dashboard showing closed revenue, opportunity status, and performance vs quota trends for sales KPIs.
4.3. Marketing KPIs
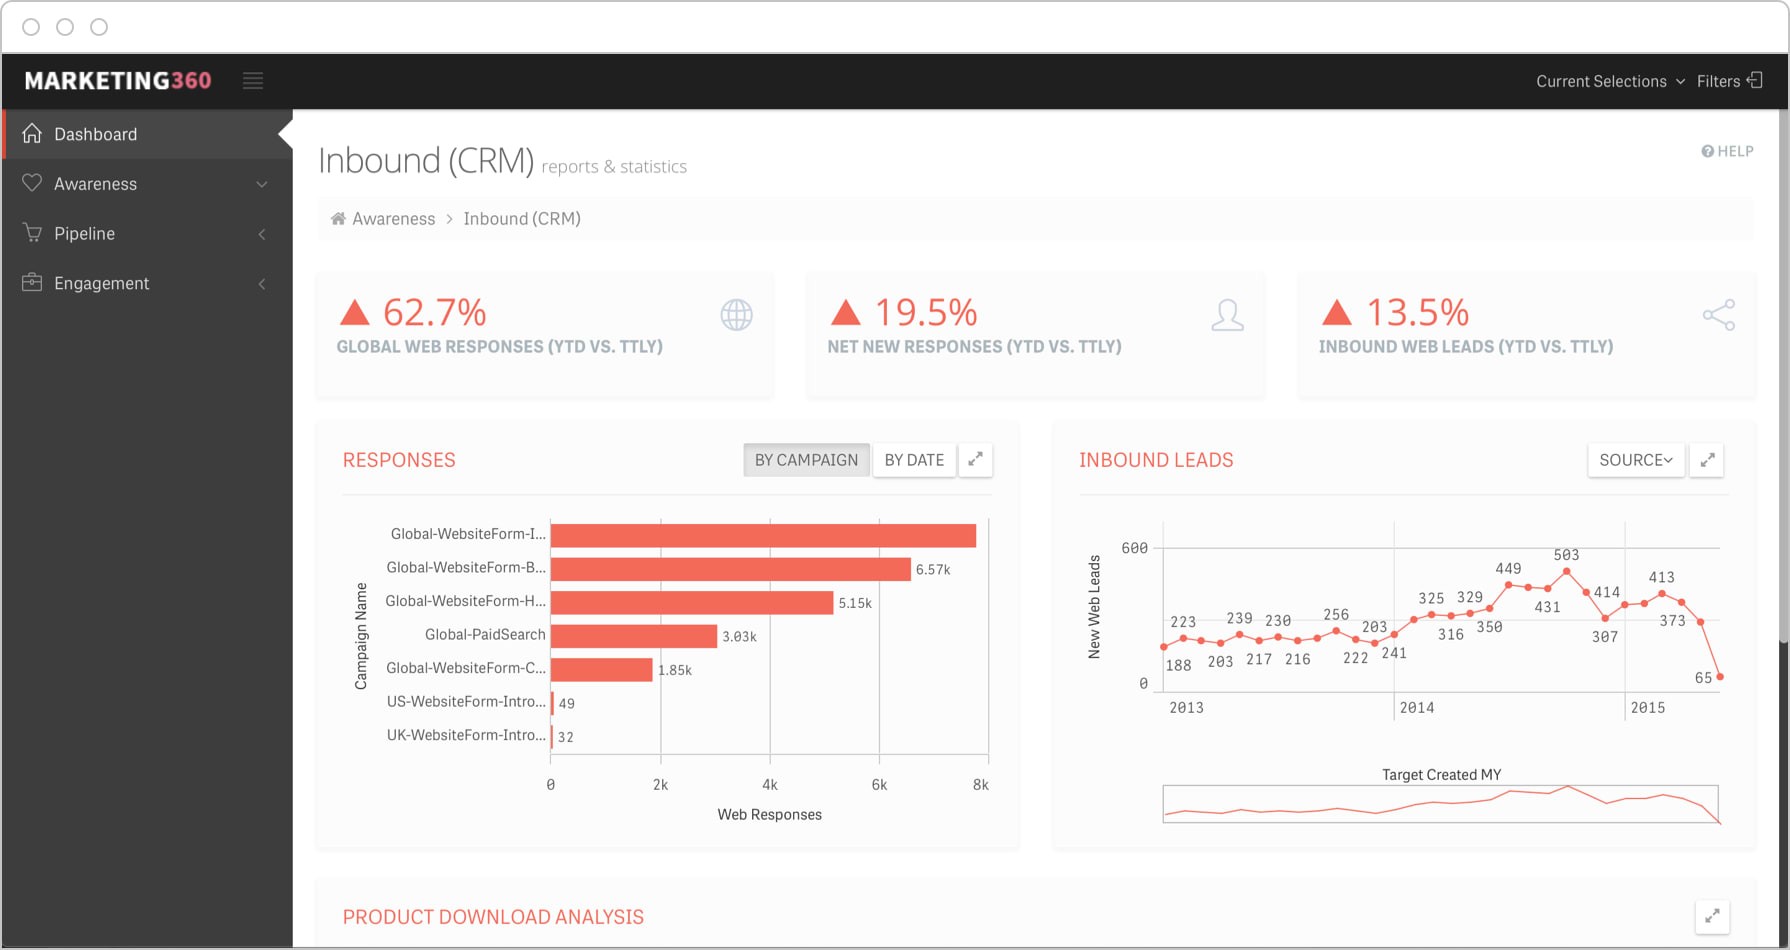
Marketing teams use KPIs to measure the effectiveness of their marketing campaigns. Examples include:
- Marketing Qualified Leads (MQLs): This KPI tracks the number of leads that have been identified as potential customers by the marketing team.
- Sales Qualified Leads (SQLs): This KPI measures the number of leads that have been passed on to the sales team for further qualification.
- Conversion Rates (For Specific Goals): This KPI tracks the percentage of website visitors who complete a desired action, such as filling out a form or making a purchase.
- Social Program ROI (By Platform): This KPI measures the return on investment for social media marketing efforts.
- Return on Ad Spend (ROAS): This KPI measures the revenue generated for every dollar spent on advertising.
Alt text: Inbound leads dashboard integrating data from multiple platforms to analyze leads and marketing campaign goals.
4.4. IT KPIs
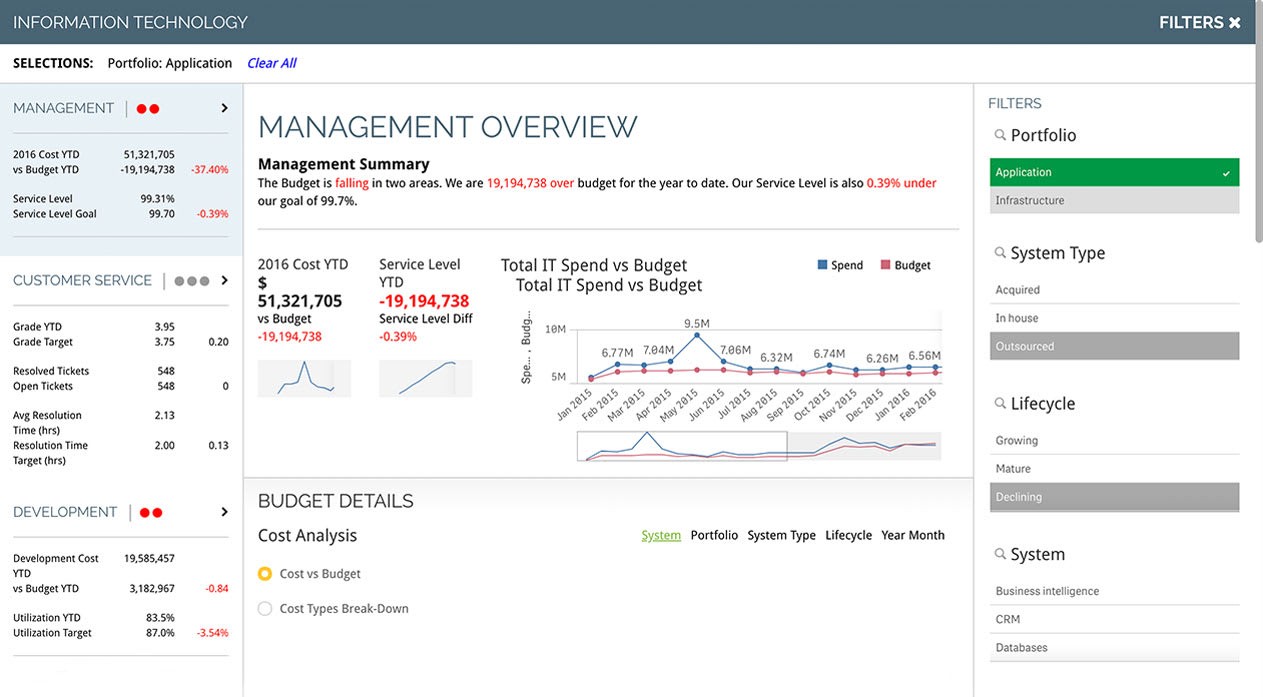
IT teams use KPIs to track the performance and efficiency of IT operations. Examples include:
- Total Support Tickets: This KPI measures the total number of support tickets received by the IT team.
- Open Support Tickets: This KPI tracks the number of support tickets that are currently open and unresolved.
- Ticket Resolution Time: This KPI measures the average time it takes to resolve a support ticket.
- Security Related Downtime: This KPI tracks the amount of time systems are down due to security incidents.
- IT Costs vs Revenue: This KPI compares IT costs to overall revenue.
- Reopened Tickets: This KPI measures the number of support tickets that are reopened after being resolved.
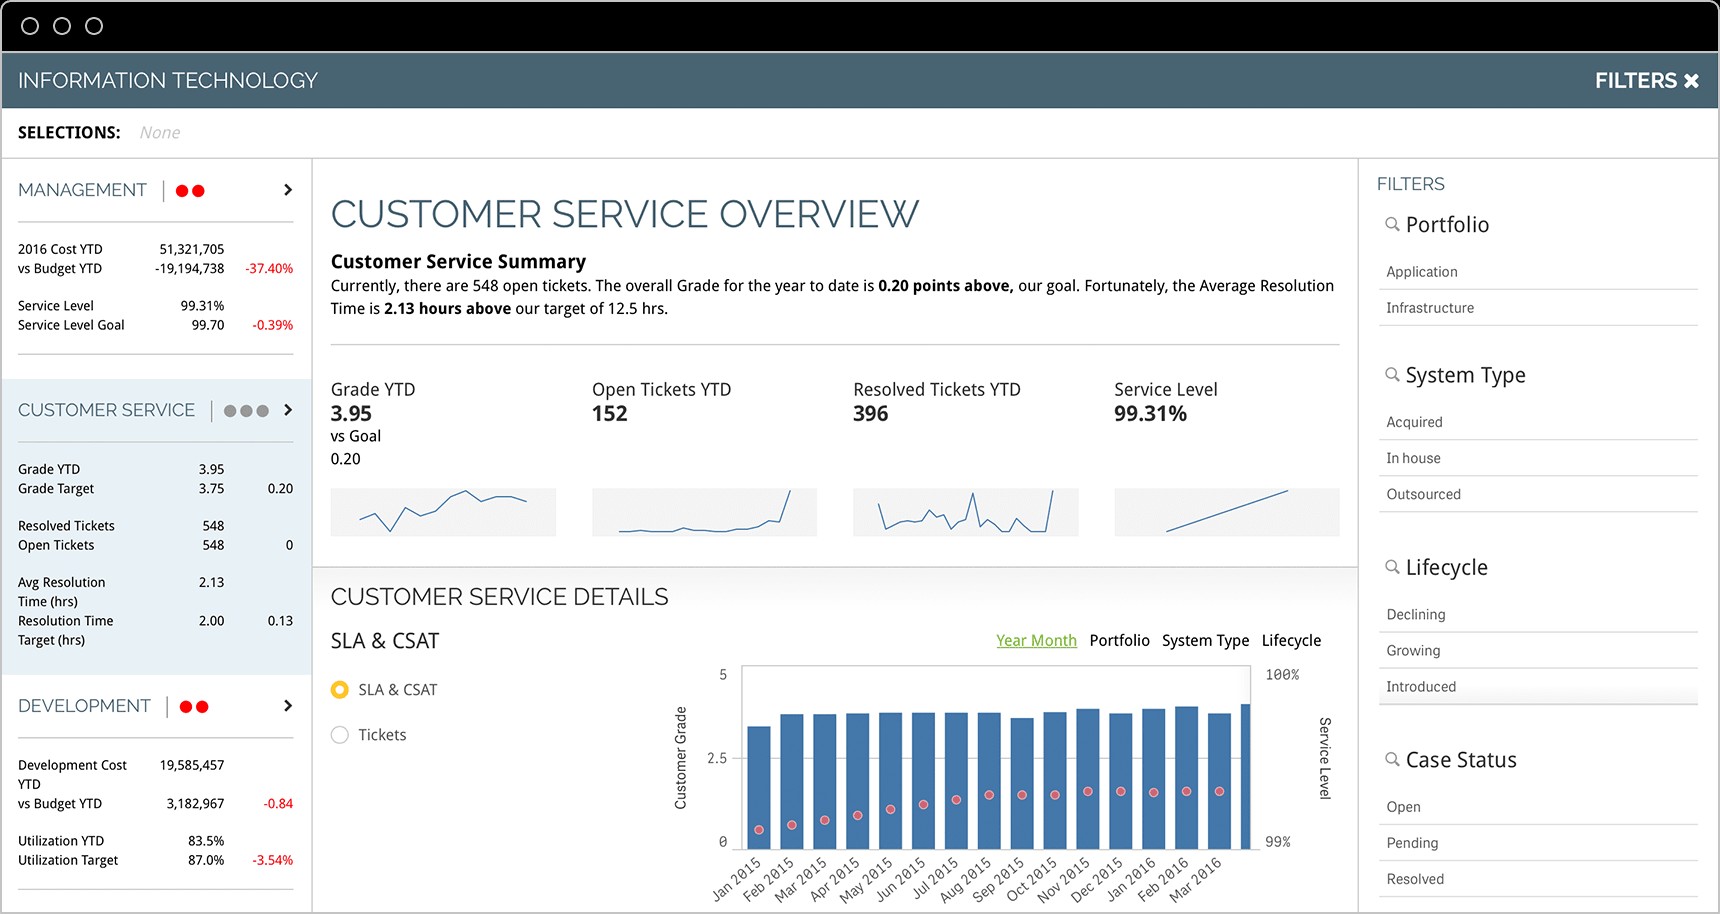
Alt text: Information Technology Management Overview dashboard displaying cost metrics for customer service, development and budget KPIs.
4.5. Customer Service KPIs
Customer service teams use KPIs to track customer satisfaction and the efficiency of their service operations. Examples include:
- First Contact Resolution Rate: This KPI measures the percentage of customer issues that are resolved during the first contact.
- Average Response Time: This KPI tracks the average time it takes for a customer service agent to respond to a customer inquiry.
- Most Active Support Agents: This KPI identifies the most active and productive support agents.
- Cost Per Conversation: This KPI measures the cost of each customer service interaction.
- Customer Effort Score: This KPI measures the amount of effort a customer has to expend to resolve an issue.
Alt text: Executive dashboard used by CIO/CTO for budget and forecasting improvement to manage lifecycle costs of IT assets and technology.
5. How to Choose the Right KPIs
5.1. Aligning KPIs with Business Objectives
The most important step in choosing the right KPIs is to align them with your overall business objectives. What are you trying to achieve as an organization? What are your strategic goals? Your KPIs should directly reflect these objectives and provide a clear indication of whether you’re making progress towards them.
5.2. Involving Stakeholders in the Selection Process
Involve stakeholders from different departments and teams in the KPI selection process. This ensures that the KPIs are relevant to everyone and that everyone is on board with the chosen metrics. It also helps to identify potential unintended consequences of focusing on certain KPIs.
5.3. Considering the SMART Criteria
When selecting KPIs, make sure they meet the SMART criteria:
- Specific: Clearly defined and focused.
- Measurable: Quantifiable and trackable.
- Achievable: Realistic and attainable.
- Relevant: Aligned with business objectives.
- Time-bound: With a defined timeframe for achievement.
5.4. Focusing on Leading and Lagging Indicators
Consider both leading and lagging indicators. Leading indicators are predictive and can help you anticipate future performance. Lagging indicators, on the other hand, measure past performance. A good balance of both types of indicators provides a comprehensive view of your business.
5.5. Regularly Reviewing and Updating KPIs
KPIs should not be set in stone. Regularly review and update your KPIs to ensure they remain relevant and aligned with your evolving business objectives. As your business changes, your KPIs may need to be adjusted to reflect new priorities and challenges.
6. Implementing KPIs Effectively
6.1. Clearly Defining and Communicating KPIs
Clearly define each KPI and communicate it to everyone in the organization. Ensure that everyone understands what the KPI measures, why it’s important, and how their performance will be evaluated against it.
6.2. Setting Realistic Targets
Set realistic targets for each KPI. Targets should be challenging but achievable. Setting targets that are too high can be demoralizing, while setting targets that are too low can lead to complacency.
6.3. Tracking and Monitoring KPIs Regularly
Track and monitor KPIs regularly. This can be done using a variety of tools, such as spreadsheets, dashboards, and business intelligence software. The key is to have a system in place to collect and analyze KPI data consistently.
6.4. Visualizing KPI Data
Visualize KPI data using charts, graphs, and dashboards. This makes it easier to identify trends, patterns, and areas of concern. Visualizations can also help to communicate KPI data to stakeholders in a clear and concise manner.
6.5. Taking Action Based on KPI Data
The ultimate goal of tracking KPIs is to take action based on the data. If KPIs are not meeting targets, investigate the reasons why and take corrective action. This may involve adjusting strategies, improving processes, or providing additional training to employees.
7. Common Mistakes to Avoid When Using KPIs
7.1. Choosing Too Many KPIs
Choosing too many KPIs can be overwhelming and distracting. Focus on a limited number of key metrics that are most critical to your business objectives.
7.2. Not Aligning KPIs with Business Objectives
If KPIs are not aligned with business objectives, they will not be effective in driving performance. Make sure your KPIs directly reflect your strategic goals.
7.3. Setting Unrealistic Targets
Setting unrealistic targets can be demoralizing and counterproductive. Targets should be challenging but achievable.
7.4. Ignoring External Factors
When analyzing KPI data, it’s important to consider external factors that may be influencing performance. These factors may include economic conditions, industry trends, and competitive pressures.
7.5. Not Regularly Reviewing and Updating KPIs
Not regularly reviewing and updating KPIs can lead to them becoming irrelevant over time. Make sure to adjust your KPIs as your business evolves.
8. Tools for Tracking and Managing KPIs
8.1. Spreadsheets (e.g., Microsoft Excel, Google Sheets)
Spreadsheets are a basic but versatile tool for tracking and managing KPIs. They can be used to create simple dashboards and generate reports.
8.2. KPI Dashboards (e.g., Klipfolio, Geckoboard)
KPI dashboards provide a visual overview of key performance indicators. They can be customized to display the most important metrics for your business.
8.3. Business Intelligence (BI) Software (e.g., Tableau, Power BI)
Business intelligence software offers advanced analytics and reporting capabilities. It can be used to track and analyze KPIs from multiple data sources.
8.4. Project Management Software (e.g., Asana, Trello)
Project management software can be used to track KPIs related to project performance and progress.
8.5. Customer Relationship Management (CRM) Software (e.g., Salesforce, HubSpot)
CRM software can be used to track KPIs related to customer satisfaction, loyalty, and retention.
9. The Future of KPIs in Business
9.1. The Rise of AI and Machine Learning
AI and machine learning are transforming the way KPIs are tracked and analyzed. These technologies can be used to automate data collection, identify patterns, and predict future performance.
9.2. Increased Focus on Real-Time Data
Businesses are increasingly demanding real-time access to KPI data. This allows them to respond quickly to changing conditions and make more informed decisions.
9.3. Greater Emphasis on Data Visualization
Data visualization is becoming increasingly important for communicating KPI data to stakeholders. Interactive dashboards and visual reports are making it easier to understand complex data.
9.4. Integration of KPIs with Business Processes
KPIs are being increasingly integrated with business processes. This allows organizations to track performance at every stage of the customer journey.
9.5. The Importance of Data Governance
As the volume of KPI data grows, data governance is becoming increasingly important. Organizations need to ensure that their KPI data is accurate, reliable, and secure.
10. Frequently Asked Questions (FAQs) about KPIs
To further clarify the topic, here are some frequently asked questions about KPIs in business:
| Question | Answer |
|---|---|
| What is the difference between a KPI and a metric? | A metric is any measurement, while a KPI is a metric that’s critical to the success of the organization and directly tied to strategic goals. |
| How many KPIs should a company track? | It’s best to focus on a limited number of key metrics (5-10) that are most critical to achieving business objectives. |
| How often should KPIs be reviewed? | KPIs should be reviewed regularly, at least quarterly, to ensure they remain relevant and aligned with business objectives. |
| What are some examples of financial KPIs? | Examples include revenue growth, gross profit margin, net profit margin, return on investment (ROI), and cash flow. |
| What are some examples of customer KPIs? | Examples include customer satisfaction score (CSAT), net promoter score (NPS), customer retention rate, customer acquisition cost (CAC), and customer lifetime value (CLTV). |
| What are some examples of operational KPIs? | Examples include production costs, inventory turnover, order fulfillment time, defect rate, and employee turnover. |
| How do I choose the right KPIs for my business? | Align KPIs with business objectives, involve stakeholders, consider the SMART criteria, focus on leading and lagging indicators, and regularly review and update KPIs. |
| What tools can I use to track and manage KPIs? | Spreadsheets, KPI dashboards, business intelligence (BI) software, project management software, and customer relationship management (CRM) software are all useful tools. |
| What are some common mistakes to avoid when using KPIs? | Choosing too many KPIs, not aligning KPIs with business objectives, setting unrealistic targets, ignoring external factors, and not regularly reviewing and updating KPIs are common mistakes. |
| How can AI and machine learning help with KPIs? | AI and machine learning can automate data collection, identify patterns, predict future performance, and provide more insightful analysis of KPI data. |
Understanding What Is Kpi In Business is crucial for driving success. By defining, implementing, and tracking the right KPIs, organizations can gain valuable insights into their performance, make data-driven decisions, and achieve their strategic goals. Remember to align your KPIs with your business objectives, involve stakeholders, and regularly review and update your metrics to ensure they remain relevant.
Do you have more questions about KPIs or other business-related topics? Visit WHAT.EDU.VN today to ask your questions and receive free, expert answers. Our community of knowledgeable professionals is ready to help you find the information you need to succeed. Don’t hesitate, visit us at 888 Question City Plaza, Seattle, WA 98101, United States, or contact us via Whatsapp at +1 (206) 555-7890. what.edu.vn – Your source for free answers to any question.