Understanding ‘mean’ in math is fundamental for grasping statistical concepts. Often referred to as the average, the mean is a crucial measure of central tendency used across various fields. This guide will explore the definition of mean in mathematics, explain how to calculate it, and illustrate its importance with examples relevant to students and parents.
Decoding “Mean” in Math: Definition and Types of Averages
In mathematics, the term “mean” typically refers to the arithmetic mean – a specific type of average. To calculate the mean, you sum all the values in a dataset and then divide that sum by the total number of values. This process gives you a central value that represents the “typical” value in the dataset.
However, it’s important to recognize that “average” in mathematics isn’t limited to just the mean. There are different measures of central tendency, each providing a unique perspective on the central value of a dataset. These include:
- Median: The middle value in a dataset when it’s ordered from least to greatest. It’s useful when dealing with datasets that have outliers, as it’s less affected by extreme values than the mean.
- Mode: The value that appears most frequently in a dataset. A dataset can have no mode, one mode, or multiple modes.
- Range: The difference between the highest and lowest values in a dataset. While not a measure of central tendency, it describes the spread of the data.
Beyond these common averages, there are also other types of means used in more advanced mathematical and statistical contexts:
- Harmonic Mean: Used for averages of rates or ratios.
- Geometric Mean: Useful for finding the average of percentages, ratios, or growth rates.
- Sample Mean: The mean calculated from a subset (sample) of a larger population, used in statistical inference.
For the purpose of this guide, and in most elementary and middle school mathematics, “mean” usually refers to the arithmetic mean.
Visualizing Mean: Making the Concept Concrete
While the formula for calculating the mean is straightforward, understanding the concept visually can significantly enhance comprehension, especially for younger learners. Often, the mean is taught using abstract methods, but visualizing it helps students grasp the underlying principle.
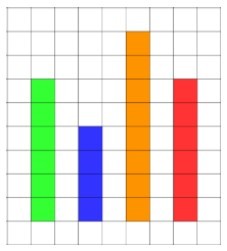
Imagine we have four teams, and we’re looking at the points they scored in a game. Let’s represent these scores visually with bars of different heights, as shown below.
To find the mean score, we perform the calculation: add up all the scores and divide by the number of teams. However, conceptually, finding the mean is like trying to redistribute the total points equally among all teams. We want to level out the bars so that they all reach the same height.
Using physical manipulatives like cubes or counters can make this even clearer for students. By physically moving blocks from taller bars to shorter ones, students can visualize the process of equal distribution that the mean represents.
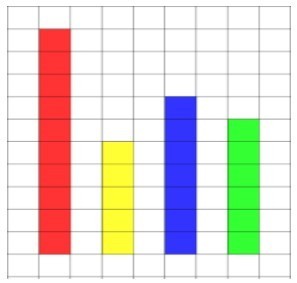
As demonstrated in the image below, by taking blocks from the taller bars and adding them to the shorter bars, we can make all bars the same height.
This leveled height represents the mean. The mean, therefore, can be understood as the value each data point would have if the total quantity were shared equally among all data points. It’s the “fair share” value.
Calculating the Mean: A Step-by-Step Guide
To calculate the mean, you need a dataset – a collection of values. Let’s consider an example using a frequency table showing the number of books read by students in a class:
| Name | Number of books read |
|---|---|
| Fred | 5 |
| Harry | 4 |
| George | 1 |
| Dudley | 2 |
| Ron | 5 |
| Arthur | 3 |
| Ginny | 8 |
| Albus | 4 |
Step 1: Sum all the data points.
Add up the number of books read by each student: 5 + 4 + 1 + 2 + 5 + 3 + 8 + 4 = 32
Encourage mental math strategies to make addition easier. For example, grouping numbers to make tens (5+5=10, 4+1=5, 2+3=5, 8+4=12; 10+5+5+12 = 32).
Step 2: Divide the sum by the number of data points.
Count the number of students (data points), which is 8.
Divide the total number of books (32) by the number of students (8): 32 ÷ 8 = 4
Therefore, the mean number of books read by the students is 4.
When is Mean Introduced in School Curricula?
Students typically begin learning about measures of central tendency, including the mean, in middle school. In the United States, 6th grade is often when the concept of mean (and median) is formally introduced as part of statistics and data analysis within the math curriculum.
Educational standards, such as the Texas Essential Knowledge and Skills (TEKS), explicitly state that 6th-grade students should be able to summarize numerical data using numerical summaries, including the mean and median. This learning is crucial for developing data literacy and analytical skills.
This introduction in middle school lays the foundation for more advanced statistical concepts in higher grades and prepares students for interpreting data in various real-world contexts.
The Broader Math Connections of Mean
Learning to calculate the mean isn’t just an isolated skill; it reinforces and connects to other important mathematical concepts:
- Addition Fluency: Calculating the mean requires adding multiple numbers, enhancing addition skills, especially when dealing with larger datasets.
- Mental Math: Encourages the use of mental math strategies for addition and division.
- Division as Inverse of Multiplication: Understanding that division is used to find the mean reinforces the relationship between multiplication and division.
- Decimals and Fractions: As students progress, they may encounter datasets that include decimals or fractions, providing practice in calculating means with these types of numbers.
Real-World Relevance of Mean
The concept of mean is far from abstract; it’s a tool used extensively in real life to understand and interpret data. Here are a few examples of its real-world applications:
- Demographics: The United States Census Bureau uses the mean to calculate the average age of the population and population mean, providing valuable demographic insights.
- Economics: Economists use mean income, mean housing prices, and other means to analyze economic trends.
- Science: Scientists use the mean to analyze experimental data, calculate average temperatures, rainfall, and more.
- Business and Finance: Businesses use mean values to analyze sales data, customer satisfaction scores, and financial performance.
- Education: Educators use mean test scores to evaluate student performance and program effectiveness.
Any profession or situation that involves data analysis is likely to utilize the mean as a key measure for drawing conclusions and making informed decisions.
Worked Examples: Calculating Mean
Let’s solidify the understanding of mean with a few more worked examples.
Example 1: Calculating Mean Detentions
| Name | Number of detentions in a year |
|---|---|
| Fred | 18 |
| Harry | 35 |
| George | 21 |
| Ron | 26 |
- Sum of data points: 18 + 35 + 21 + 26 = 100
- Number of data points: 4 (students)
- Mean: 100 ÷ 4 = 25
The mean number of detentions is 25.
Example 2: Calculating Mean Merits
| Name | Number of merits |
|---|---|
| Fred | 45 |
| Harry | 37 |
| George | 43 |
| Ron | 46 |
| Ginny | 54 |
- Sum of data points: 45 + 37 + 43 + 46 + 54 = 225
- Number of data points: 5 (students)
- Mean: 225 ÷ 5 = 45 (Using partitioning: 200 ÷ 5 = 40, 25 ÷ 5 = 5, 40 + 5 = 45)
The mean number of merits is 45.
Practice Questions: Test Your Understanding of Mean
Test your knowledge with these practice questions:
1. Concrete Visualization: Use a visual representation (like blocks or drawings) to equally distribute the quantities shown below. What is the mean value represented by each row after equal distribution?
Answer: Each row should have 7 blocks.
2. Sentence Completion: Fill in the blanks to complete the sentence about calculating the mean:
“To find the mean, first ______ all the data sets and then ______ by the ______ of data sets.”
Answer: To find the mean, first add all the data sets and then divide by the number of data sets.
3. Calculate the Mean Books Read: Find the mean number of books read for the following data:
| Name | Number of books read |
|---|---|
| Fred | 7 |
| Harry | 4 |
| George | 2 |
| Dudley | 4 |
| Ron | 3 |
Answer: The mean is 4.
4. Spot the Mistake: Joshua tried to calculate the mean weight of pigs. Identify his mistake:
| Pig 1 | Pig 2 | Pig 3 |
|---|---|---|
| 54kg | 55kg | 59kg |
Calculation: 54 + 55 + 59 = 168kg, 168 ÷ 6 = 28. Joshua concluded: “The mean weight is 28kg.”
Answer: Joshua’s mistake is that he divided by 6 instead of 3 (the number of pigs).
5. Calculate the Mean Cookies Eaten: Find the mean number of cookies eaten based on the table below.
| Name | Number of cookies eaten |
|---|---|
| Trevor | 25 |
| Pritesh | 32 |
| Janice | 28 |
| Moe | 35 |
| Sue | 30 |
Answer: The mean is 30. (25+32+28+35+30 = 150, 150 / 5 = 30)
Frequently Asked Questions about Mean in Math
What is a mean in math?
A mean in math is the average of a dataset. It’s calculated by adding all the numbers in the dataset together and then dividing the sum by the total count of numbers in the set. For example, in the dataset: 8, 9, 5, 6, 7, the mean is 7 because (8 + 9 + 5 + 6 + 7) = 35, and 35 ÷ 5 = 7.
What is the definition of mean?
The mean is defined as the average value of a set of numbers. It’s a measure of central tendency that represents a typical or central value in the dataset.
What is the mean of 1, 2, 3, 4, 5?
The mean of the dataset 1, 2, 3, 4, 5 is 3. (1 + 2 + 3 + 4 + 5 = 15, and 15 ÷ 5 = 3).
Understanding the mean is a vital step in developing mathematical and statistical literacy. By grasping its definition, calculation, and real-world applications, students and parents can confidently navigate data and interpret the world around them.