What Is The Interquartile Range? This statistical measure, also known as IQR, is a key concept for understanding data spread. At WHAT.EDU.VN, we aim to provide clear and accessible explanations of complex topics, offering solutions for learners of all levels. Understand IQR calculation, interpretation, and its applications.
1. Understanding the Interquartile Range (IQR)
The interquartile range is a measure of statistical dispersion, representing the spread of the middle 50% of a dataset. It is calculated as the difference between the third quartile (Q3) and the first quartile (Q1). Understanding the interquartile range formula allows for a better understanding of data variability.
1.1. Definition of Interquartile Range
The interquartile range (IQR) is a measure of where the “middle fifty” lies in a data set. It’s found by subtracting the first quartile (Q1) from the third quartile (Q3). This range provides insight into the spread of data values around the median. This statistical concept helps understand data distribution and identify outliers.
1.2. Importance of IQR in Statistics
The IQR is a robust measure of variability, less sensitive to extreme values (outliers) than the range. It’s particularly useful when dealing with skewed distributions or datasets containing outliers. It can be used to compare the variability between different data sets. Use the IQR formula to analyze data variability effectively.
1.3. IQR vs. Range: A Comparison
The range is the difference between the maximum and minimum values in a dataset, while the IQR focuses on the middle 50%. The range is highly influenced by outliers, while the IQR is not.
| Feature | Range | Interquartile Range (IQR) |
|---|---|---|
| Definition | Max value – Min value | Q3 – Q1 |
| Sensitivity to Outliers | Very Sensitive | Robust (Less Sensitive) |
| Data Focus | Entire dataset | Middle 50% of data |
| Use Cases | Simple variability measure | Skewed data, outlier presence |
2. Quartiles: The Building Blocks of IQR
Quartiles divide a dataset into four equal parts. The first quartile (Q1) is the median of the lower half, the second quartile (Q2) is the median of the entire dataset, and the third quartile (Q3) is the median of the upper half. Understanding how to calculate quartiles is essential for determining the IQR.
2.1. First Quartile (Q1): The 25th Percentile
The first quartile (Q1) represents the 25th percentile of the data. It’s the value below which 25% of the data points fall. Q1 marks the lower boundary of the interquartile range, indicating where the bottom quarter of the dataset ends.
2.2. Second Quartile (Q2): The Median
The second quartile (Q2) is the median of the dataset. It divides the data into two equal halves, with 50% of the values falling below it and 50% above it. The median is a measure of central tendency, resistant to the influence of outliers.
2.3. Third Quartile (Q3): The 75th Percentile
The third quartile (Q3) represents the 75th percentile of the data. It’s the value below which 75% of the data points fall. Q3 marks the upper boundary of the interquartile range, indicating where the top quarter of the dataset begins.
3. Calculating the Interquartile Range: A Step-by-Step Guide
To calculate the interquartile range, follow these steps:
- Arrange the data in ascending order.
- Find the median (Q2) of the dataset.
- Determine the first quartile (Q1) as the median of the lower half.
- Determine the third quartile (Q3) as the median of the upper half.
- Calculate the IQR using the formula: IQR = Q3 – Q1.
3.1. Step 1: Ordering the Data
The first step in calculating the IQR is to arrange the dataset in ascending order. This makes it easier to identify the median and subsequent quartiles. Ordering the data ensures accurate quartile determination.
3.2. Step 2: Finding the Median (Q2)
The median (Q2) is the middle value of the ordered dataset. If the dataset has an odd number of values, the median is the central value. If the dataset has an even number of values, the median is the average of the two central values.
3.3. Step 3: Determining Q1 and Q3
Q1 is the median of the lower half of the data (excluding the median if the dataset has an odd number of values). Q3 is the median of the upper half of the data (excluding the median if the dataset has an odd number of values).
3.4. Step 4: Calculating the IQR
Once Q1 and Q3 are determined, the IQR is calculated using the formula: IQR = Q3 – Q1. This difference represents the range containing the middle 50% of the data. This statistical calculation is essential for data analysis.
4. Interquartile Range Formula: A Deeper Dive
The interquartile range formula is straightforward: IQR = Q3 – Q1. This formula provides a measure of statistical dispersion that is resistant to outliers. Applying the interquartile range formula accurately is critical for statistical analysis.
4.1. Understanding the Components of the Formula
The IQR formula consists of two components: Q3 (the third quartile) and Q1 (the first quartile). Q3 represents the 75th percentile, while Q1 represents the 25th percentile.
4.2. Applying the Formula in Practice
To apply the IQR formula, first determine the values of Q1 and Q3 for the dataset. Then, subtract Q1 from Q3 to obtain the IQR. This result represents the spread of the middle 50% of the data.
4.3. Common Mistakes to Avoid
Common mistakes when calculating the IQR include incorrectly identifying Q1 and Q3, not ordering the data first, or including the median in the lower or upper halves when determining Q1 and Q3. Avoid these errors to ensure accurate IQR calculation.
5. Interquartile Range Example: A Practical Demonstration
Let’s consider a dataset: 5, 7, 9, 11, 13, 15, 17, 19, 21.
- The data is already in ascending order.
- The median (Q2) is 13.
- Q1 is the median of 5, 7, 9, 11, which is 8.
- Q3 is the median of 15, 17, 19, 21, which is 18.
- IQR = Q3 – Q1 = 18 – 8 = 10.
5.1. Example Dataset and Its Properties
Consider the dataset: 10, 12, 14, 16, 18, 20, 22, 24, 26. This dataset is evenly distributed, allowing for a clear demonstration of IQR calculation.
5.2. Step-by-Step Calculation of IQR
- Data is in ascending order.
- Median (Q2) = 18.
- Q1 (median of 10, 12, 14, 16) = 13.
- Q3 (median of 20, 22, 24, 26) = 23.
- IQR = Q3 – Q1 = 23 – 13 = 10.
5.3. Interpreting the Result
The IQR of 10 indicates that the middle 50% of the data spans a range of 10 units. This provides insight into the data’s variability around the median. Understanding IQR results helps interpret data dispersion accurately.
6. Interquartile Range Calculator: Tools for Efficiency
While manual calculation is important for understanding the concept, online IQR calculators can save time and reduce errors. These tools automate the process, providing quick and accurate results. Using an interquartile range calculator can improve efficiency in data analysis.
6.1. Benefits of Using a Calculator
IQR calculators offer several benefits:
- Speed: Quick calculation of IQR.
- Accuracy: Reduces manual calculation errors.
- Convenience: Accessible online.
- Efficiency: Saves time in data analysis.
6.2. Popular Online Calculators
Several online IQR calculators are available, including those offered by statistical websites and educational resources. These calculators typically require inputting the dataset, and they automatically compute Q1, Q3, and the IQR.
6.3. Limitations and Precautions
While calculators are useful, it’s important to understand the underlying concepts. Always double-check the results and ensure the data is entered correctly. Do not solely rely on calculators without understanding the statistical principles involved.
7. Interpreting the Interquartile Range: What Does It Tell Us?
The IQR provides valuable information about the spread of the middle 50% of the data. A smaller IQR indicates less variability, while a larger IQR indicates greater variability. IQR is essential for understanding data distribution and identifying outliers.
7.1. Understanding Data Spread
The IQR represents the range within which the central half of the data lies. This provides a measure of how closely the data points are clustered around the median.
7.2. Identifying Outliers
The IQR is used to identify potential outliers. Values that fall below Q1 – 1.5 IQR or above Q3 + 1.5 IQR are often considered outliers. The interquartile range outliers formula helps identify unusual data points.
7.3. Comparing Different Datasets
The IQR can be used to compare the variability between different datasets. A dataset with a smaller IQR is more tightly clustered around its median than a dataset with a larger IQR. Comparing IQR values provides insights into relative data dispersion.
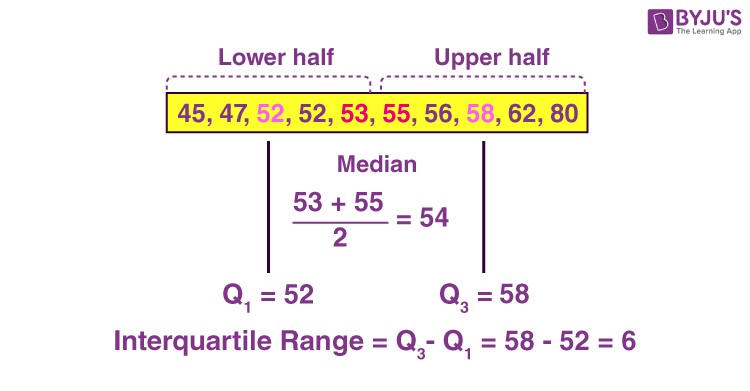 Interquartile range visualization
8. Semi Interquartile Range: A Related Measure
The semi interquartile range is half of the IQR, calculated as (Q3 – Q1) / 2. It provides a measure of the average distance of the quartiles from the median. This related statistical measure is useful in certain contexts.
8.1. Definition and Formula
The semi-interquartile range is calculated as half the difference between the third and first quartiles: (Q3 – Q1) / 2. This measure represents half of the interquartile range.
8.2. Interpretation of Semi-IQR
The semi-IQR provides an estimate of the typical distance of data points from the median. It is less commonly used than the IQR but can be useful in specific statistical analyses.
8.3. When to Use Semi-IQR
The semi-IQR is used when a more granular measure of dispersion is needed. It is particularly useful when comparing datasets with different scales or units of measurement.
9. Applications of Interquartile Range in Real-World Scenarios
The IQR has numerous applications in various fields, including:
- Finance: Assessing the volatility of stock prices.
- Healthcare: Analyzing patient data and identifying outliers in medical measurements.
- Education: Evaluating student performance and identifying students who may need additional support.
- Environmental Science: Analyzing environmental data and detecting anomalies.
9.1. IQR in Finance
In finance, the IQR is used to assess the volatility of investments. A higher IQR indicates greater price fluctuations, while a lower IQR suggests more stable prices. Analyzing IQR in finance aids risk assessment.
9.2. IQR in Healthcare
In healthcare, the IQR is used to analyze patient data, such as blood pressure readings or cholesterol levels. It helps identify patients with extreme values that may require further investigation.
9.3. IQR in Education
In education, the IQR is used to evaluate student performance on standardized tests. It helps identify students who are performing significantly above or below the average.
10. Advantages and Disadvantages of Using IQR
The IQR has several advantages:
- Robustness: Less sensitive to outliers.
- Simplicity: Easy to calculate and interpret.
- Versatility: Applicable to various types of data.
However, it also has some disadvantages:
- Ignores Extreme Values: Only considers the middle 50% of the data.
- Less Precise: May not capture subtle differences in variability.
- Limited Information: Doesn’t provide a complete picture of the data distribution.
10.1. Strengths of IQR
The strengths of the IQR include its robustness to outliers, ease of calculation, and applicability to various data types. It provides a reliable measure of variability for skewed distributions.
10.2. Limitations of IQR
The limitations of the IQR include its exclusion of extreme values, potential imprecision, and limited information about the overall data distribution.
10.3. When to Use Other Measures of Dispersion
In some cases, other measures of dispersion, such as standard deviation or variance, may be more appropriate. If the data is normally distributed and outliers are not a concern, standard deviation may provide a more complete picture of variability.
11. IQR and Box Plots: A Visual Representation
Box plots are a visual representation of data that displays the median, quartiles, and outliers. The IQR is represented by the length of the box in the box plot. Box plots provide a visual summary of the data distribution.
11.1. Components of a Box Plot
A box plot consists of the following components:
- Median: The middle line of the box.
- Quartiles: The edges of the box (Q1 and Q3).
- Whiskers: Lines extending from the box to the farthest data points within 1.5 * IQR.
- Outliers: Data points beyond the whiskers.
11.2. How IQR Is Represented in a Box Plot
The length of the box in a box plot represents the IQR. This provides a visual indication of the spread of the middle 50% of the data.
11.3. Interpreting Box Plots Using IQR
By examining the length of the box and the position of the whiskers and outliers, one can gain insights into the data’s distribution, variability, and presence of extreme values. Box plots are useful for comparing distributions across different datasets.
12. IQR in Different Types of Data Distributions
The IQR can be used to analyze data from various types of distributions, including normal, skewed, and bimodal distributions. The interpretation of the IQR may vary depending on the distribution type.
12.1. IQR in Normal Distributions
In a normal distribution, the IQR is symmetrically distributed around the median. The IQR provides a measure of the spread of the central portion of the data.
12.2. IQR in Skewed Distributions
In a skewed distribution, the IQR may not be symmetrically distributed around the median. The IQR is particularly useful for analyzing skewed data because it is less sensitive to extreme values.
12.3. IQR in Bimodal Distributions
In a bimodal distribution, the IQR may reflect the spread of the data around the two modes. The interpretation of the IQR in a bimodal distribution may require additional analysis.
13. Advanced Topics Related to IQR
Several advanced topics are related to the IQR, including:
- Adjusted IQR: Modifications to the IQR to account for sample size or other factors.
- Bootstrapping IQR: Estimating the IQR using bootstrapping methods.
- IQR in Nonparametric Statistics: Using the IQR in nonparametric statistical tests.
13.1. Adjusted IQR
Adjusted IQR is a modified version of the IQR that accounts for sample size or other factors. This adjustment can improve the accuracy of the IQR in certain situations.
13.2. Bootstrapping IQR
Bootstrapping IQR involves estimating the IQR using bootstrapping methods. This technique is useful when the data does not follow a known distribution.
13.3. IQR in Nonparametric Statistics
The IQR is used in nonparametric statistical tests, such as the Mann-Whitney U test and the Kruskal-Wallis test. These tests do not assume that the data follows a specific distribution.
14. Common Misconceptions About Interquartile Range
Common misconceptions about the interquartile range include:
- Confusing it with the range.
- Thinking it includes all the data.
- Believing it’s only useful for normal distributions.
14.1. IQR Is Not the Same as Range
The IQR is not the same as the range. The range is the difference between the maximum and minimum values, while the IQR is the difference between the third and first quartiles.
14.2. IQR Does Not Include All Data
The IQR does not include all the data. It only represents the spread of the middle 50% of the data.
14.3. IQR Is Useful Beyond Normal Distributions
The IQR is useful beyond normal distributions. It is particularly valuable for analyzing skewed data or data with outliers.
15. How to Improve Your Understanding of IQR
To improve your understanding of the IQR:
- Practice calculating it with different datasets.
- Visualize it using box plots.
- Apply it in real-world scenarios.
- Consult statistical resources and experts.
15.1. Practice Calculations
Practice calculating the IQR with various datasets to reinforce your understanding of the concept. Use different types of data distributions to challenge yourself.
15.2. Visual Aids and Tools
Use visual aids, such as box plots, to visualize the IQR and its relationship to the data distribution. Online calculators can also be helpful for checking your calculations.
15.3. Seeking Expert Guidance
Consult statistical resources, textbooks, or experts to clarify any questions or misconceptions you may have about the IQR.
16. The Future of IQR in Data Analysis
The IQR will continue to be an important tool in data analysis due to its robustness, simplicity, and versatility. It will likely be integrated into new statistical methods and software applications.
16.1. Emerging Trends
Emerging trends in the use of the IQR include its integration with machine learning algorithms and its application to big data analysis.
16.2. Role in Big Data Analytics
The IQR is valuable in big data analytics for identifying outliers and assessing data variability. Its robustness makes it suitable for handling large, complex datasets.
16.3. Integration with Machine Learning
The IQR is increasingly integrated with machine learning algorithms for data preprocessing and feature selection. It helps improve the accuracy and efficiency of machine learning models.
17. FAQ About Interquartile Range
| Question | Answer |
|---|---|
| What is the interquartile range (IQR)? | The IQR is the difference between the third quartile (Q3) and the first quartile (Q1) in a dataset. |
| How do you calculate the IQR? | Arrange data, find Q1 and Q3, then subtract: IQR = Q3 – Q1. |
| Why is IQR useful? | It measures data spread, is resistant to outliers, and helps compare variability between datasets. |
| What is a quartile? | A quartile divides data into four equal parts: Q1 (25th percentile), Q2 (median), Q3 (75th percentile). |
| How does IQR relate to box plots? | The length of the box in a box plot represents the IQR, showing the spread of the middle 50% of data. |
| Can IQR be used for all data distributions? | Yes, but it’s particularly useful for skewed data as it is less sensitive to extreme values. |
| What is the semi-interquartile range? | Half of the IQR: (Q3 – Q1) / 2. It estimates the typical distance of data points from the median. |
| How does IQR help identify outliers? | Values below Q1 – 1.5 IQR or above Q3 + 1.5 IQR are often considered outliers. |
| What are the limitations of IQR? | It ignores extreme values and may not capture subtle differences in variability. |
| Where can I find an IQR calculator? | Many online statistical websites and educational resources offer IQR calculators. |
18. Test Your Knowledge: Quiz on Interquartile Range
Question 1: What does the interquartile range measure?
A) The entire range of the data
B) The spread of the middle 50% of the data
C) The average value of the data
D) The number of outliers in the data
Question 2: Which of the following is the correct formula for calculating the IQR?
A) IQR = Q1 – Q3
B) IQR = Q3 + Q1
C) IQR = Q3 – Q1
D) IQR = (Q3 – Q1) / 2
Question 3: What does Q1 represent?
A) The median of the dataset
B) The 25th percentile of the data
C) The 75th percentile of the data
D) The maximum value of the data
Question 4: How is the IQR represented in a box plot?
A) The length of the whiskers
B) The position of the median line
C) The length of the box
D) The location of the outliers
Question 5: What is a major advantage of using the IQR?
A) It includes all data points
B) It is highly sensitive to outliers
C) It is easy to calculate and interpret
D) It provides a complete picture of data distribution
Answers: 1) B, 2) C, 3) B, 4) C, 5) C
19. Further Resources for Learning About IQR
- Statistical textbooks
- Online statistical courses
- Educational websites
- Research papers
- Statistical software documentation
19.1. Recommended Books
Recommended books for learning about the IQR include introductory statistics textbooks and data analysis guides.
19.2. Online Courses and Tutorials
Online courses and tutorials on statistics websites can provide comprehensive instruction on the IQR.
19.3. Websites and Articles
Educational websites and research articles offer additional resources for understanding the IQR and its applications.
20. Conclusion: Mastering the Interquartile Range
Mastering the interquartile range is essential for anyone working with data. By understanding its definition, calculation, interpretation, and applications, you can gain valuable insights into data variability and make more informed decisions. The interquartile range is a statistical concept that is useful for all.
20.1. Key Takeaways
Key takeaways from this article include the definition of the IQR, the steps for calculating it, its interpretation, and its applications in various fields. The interquartile range formula should now be understood.
20.2. Encouragement for Further Learning
Continue exploring the world of statistics and data analysis to enhance your skills and knowledge. The IQR is just one tool in a vast array of statistical methods.
20.3. Call to Action
Do you have more questions about statistical concepts like the interquartile range, or any other topic that’s puzzling you? Don’t hesitate! Visit WHAT.EDU.VN today and ask your question for free. Our community of experts is ready to provide clear, helpful answers tailored to your needs. Get the insights you need to excel—reach out to us now at 888 Question City Plaza, Seattle, WA 98101, United States. Contact us on Whatsapp: +1 (206) 555-7890. Visit our website: what.edu.vn.