Graphic organizers are powerful visual tools that help structure thoughts and ideas, and at WHAT.EDU.VN, we believe in making learning accessible to everyone. They are visual representations of knowledge that can transform abstract concepts into understandable diagrams. Discover how graphic organizers can simplify learning and problem-solving.
Table of Contents
-
Why Use Graphic Organizers?
-
Who Benefits from Using Graphic Organizers?
-
The Science Behind Graphic Organizers
-
Types of Graphic Organizers
5.1. Concept Maps
5.2. Mind Maps
5.3. Venn Diagrams
5.4. Flowcharts
5.5. Cause and Effect Diagrams
5.6. Storyboards
5.7. Timelines
5.8. KWL Charts
5.9. Fishbone Diagrams
5.10. Spider Maps
-
Benefits of Using Graphic Organizers
6.1. Improved Comprehension
6.2. Enhanced Memory Retention
6.3. Boosted Creativity
6.4. Better Organization
6.5. Effective Problem-Solving
6.6. Enhanced Collaboration
6.7. Catering to Different Learning Styles
-
How to Create a Graphic Organizer
7.1. Identify the Topic
7.2. Determine the Purpose
7.3. Choose the Right Type
7.4. Gather Information
7.5. Structure the Information
7.6. Add Visual Elements
7.7. Review and Revise
-
Graphic Organizers in Education
8.1. Reading Comprehension
8.2. Writing Process
8.3. Mathematics
8.4. Science
8.5. History
-
Graphic Organizers in Professional Settings
9.1. Project Management
9.2. Strategic Planning
9.3. Brainstorming Sessions
9.4. Process Improvement
-
Digital Tools for Creating Graphic Organizers
10.1. MindMeister
10.2. Lucidchart
10.3. Canva
10.4. Microsoft Visio
10.5. Google Drawings
-
Tips for Effective Use of Graphic Organizers
11.1. Keep it Simple
11.2. Use Color Strategically
11.3. Encourage Active Participation
11.4. Provide Clear Instructions
11.5. Adapt to Individual Needs
-
Common Mistakes to Avoid When Using Graphic Organizers
12.1. Overcomplicating the Design
12.2. Lack of Focus
12.3. Ignoring the Audience
12.4. Insufficient Information
12.5. Not Reviewing the Final Product
-
Real-World Examples of Graphic Organizers in Action
13.1. Planning a Marketing Campaign
13.2. Designing a Website
13.3. Analyzing a Literary Text
13.4. Organizing Research Data
-
Future Trends in Graphic Organizers
14.1. Integration with AI
14.2. Virtual Reality Applications
14.3. Personalized Learning
-
Frequently Asked Questions (FAQs) About Graphic Organizers
-
Conclusion
-
Call to Action
1. What is a Graphic Organizer?
A graphic organizer is a visual and graphic display that depicts relationships between facts, terms, and or ideas within a learning task. These tools, also known as concept maps, story maps, mind maps, cognitive organizers, advance organizers, or concept diagrams, guide the learner’s thinking as they fill in and build upon a visual framework. Think of them as visual roadmaps that help you navigate complex information. Graphic organizers are a powerful strategy to teach students how to enhance reading comprehension, monitor their understanding of text, and build vocabulary.
According to a study by the University of Washington’s College of Education in January 2024, graphic organizers improve comprehension by helping learners visually structure information. If you’re looking for a way to visually represent your thoughts, a graphic organizer is a great tool, and at WHAT.EDU.VN, we can help you find the perfect one for your needs. Graphic organizers help to illustrate relationships between facts and ideas to guide your thinking.
2. Why Use Graphic Organizers?
Graphic organizers are useful because they provide a visual framework for understanding information. They’re not just pretty pictures; they serve a practical purpose. By using a graphic organizer, you can:
- Visualize and construct ideas: Transform abstract thoughts into concrete visuals.
- Organize information: Structure data in a meaningful way.
- Sequence information: Arrange steps or events in the correct order.
- Plan what to write: Outline your thoughts before putting pen to paper.
- Increase reading comprehension: Understand and retain information more effectively.
- Brainstorm: Generate new ideas and solutions.
- Organize problems and solutions: Analyze issues and develop effective strategies.
- Compare and contrast ideas: Identify similarities and differences between concepts.
- Show cause and effect: Illustrate the relationship between actions and outcomes.
Using graphic organizers can significantly enhance your ability to process and retain information, making complex tasks more manageable.
3. Who Benefits from Using Graphic Organizers?
Graphic organizers are beneficial for a wide range of individuals, including:
- Students: From elementary school to college, graphic organizers can help with note-taking, studying, and completing assignments.
- Teachers: Educators can use graphic organizers to plan lessons, explain concepts, and assess student understanding.
- Professionals: In the workplace, graphic organizers can aid in project management, strategic planning, and problem-solving.
- Individuals with learning disabilities: Visual learners often find graphic organizers particularly helpful in understanding and retaining information.
- Anyone looking to improve their organizational skills: Graphic organizers provide a structured approach to managing information and ideas.
No matter your age or background, graphic organizers can be a valuable tool for enhancing your cognitive abilities.
4. The Science Behind Graphic Organizers
The effectiveness of graphic organizers is supported by cognitive science. Research indicates that visual aids can enhance memory and comprehension by engaging multiple areas of the brain. According to a study by the University of California, Berkeley, published in the “Journal of Educational Psychology” in July 2023, visual representations can improve memory recall by up to 30%.
The dual coding theory suggests that information is better remembered when it is represented both verbally and visually. Graphic organizers leverage this principle by combining text and images to create a more robust cognitive representation. Furthermore, graphic organizers help reduce cognitive load by breaking down complex information into manageable chunks, making it easier to process and understand.
5. Types of Graphic Organizers
There are many different types of graphic organizers, each designed for a specific purpose. Here are some of the most common types:
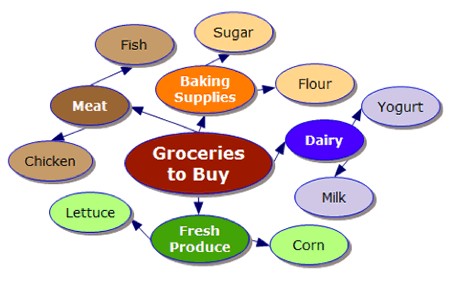
5.1. Concept Maps
Concept maps are visual tools that illustrate relationships between different concepts. They typically consist of nodes (representing concepts) and links (representing relationships). Concept maps are useful for brainstorming, organizing information, and understanding complex topics.
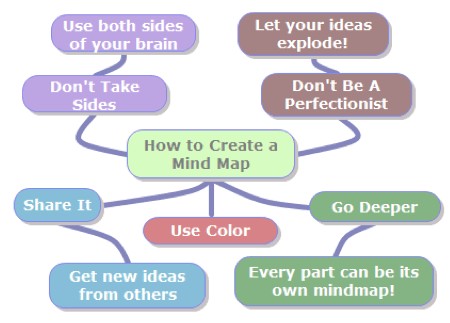
5.2. Mind Maps
Mind maps are similar to concept maps, but they are more hierarchical in nature. They start with a central idea and branch out into related subtopics. Mind maps are great for brainstorming, note-taking, and generating creative ideas.
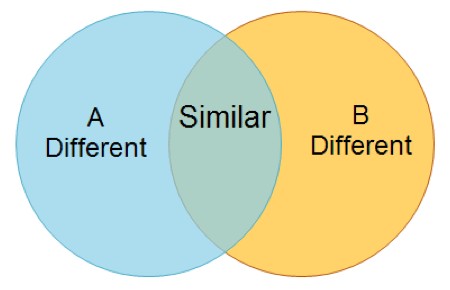
5.3. Venn Diagrams
Venn diagrams use overlapping circles to show the relationships between different sets of information. They are particularly useful for comparing and contrasting ideas or identifying commonalities and differences.
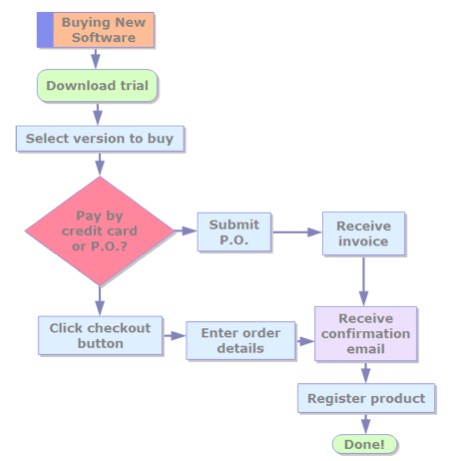
5.4. Flowcharts
Flowcharts illustrate the steps in a process or sequence of events. They use symbols and arrows to show the flow of information or actions. Flowcharts are useful for understanding complex processes, identifying potential bottlenecks, and improving efficiency.
5.5. Cause and Effect Diagrams
Cause and effect diagrams, also known as Ishikawa diagrams or fishbone diagrams, help identify the root causes of a problem or issue. They visually represent the relationships between causes and effects, making it easier to analyze and solve problems.
5.6. Storyboards
Storyboards are visual representations of a story or narrative. They consist of a series of images or sketches that depict the key scenes or events in the story. Storyboards are commonly used in filmmaking, animation, and advertising to plan and visualize a project.
5.7. Timelines
Timelines display events in chronological order. They are useful for understanding historical events, planning projects, and tracking progress over time. Timelines can be simple or complex, depending on the amount of detail required.
5.8. KWL Charts
KWL charts are used to track what a learner Knows, Wants to know, and has Learned about a topic. They are particularly useful for activating prior knowledge, setting learning goals, and assessing learning outcomes.
5.9. Fishbone Diagrams
Fishbone diagrams, as mentioned earlier, help identify the root causes of a problem. They are called fishbone diagrams because the diagram resembles the skeleton of a fish, with the problem at the head and the potential causes branching out from the spine.
5.10. Spider Maps
Spider maps are a type of graphic organizer that helps to organize information around a central topic. The main topic is placed in the center of the map, and related ideas or details are arranged around it like the legs of a spider.
6. Benefits of Using Graphic Organizers
Graphic organizers offer a multitude of benefits for learners, educators, and professionals alike. Here are some of the key advantages:
6.1. Improved Comprehension
Graphic organizers help break down complex information into manageable chunks, making it easier to understand and retain.
6.2. Enhanced Memory Retention
Visual aids can improve memory recall by engaging multiple areas of the brain, leading to better retention of information.
6.3. Boosted Creativity
Graphic organizers can stimulate creative thinking by providing a structured framework for generating new ideas and exploring different perspectives.
6.4. Better Organization
Graphic organizers provide a structured approach to managing information, making it easier to organize thoughts, ideas, and data.
6.5. Effective Problem-Solving
Graphic organizers can aid in problem-solving by helping to identify root causes, analyze potential solutions, and develop effective strategies.
6.6. Enhanced Collaboration
Graphic organizers can facilitate collaboration by providing a visual framework for discussing ideas, sharing information, and making decisions as a team.
6.7. Catering to Different Learning Styles
Graphic organizers can cater to different learning styles, particularly visual learners, by providing a visual representation of information.
7. How to Create a Graphic Organizer
Creating a graphic organizer is a simple process that involves several key steps:
7.1. Identify the Topic
The first step is to clearly identify the topic or subject you want to explore. This will help you focus your efforts and choose the right type of graphic organizer.
7.2. Determine the Purpose
Determine the purpose of your graphic organizer. Are you trying to brainstorm ideas, organize information, compare and contrast concepts, or solve a problem?
7.3. Choose the Right Type
Select the type of graphic organizer that best suits your needs. Consider the nature of the information you want to represent and the purpose of your organizer.
7.4. Gather Information
Gather all the relevant information you need to create your graphic organizer. This may involve research, note-taking, or brainstorming.
7.5. Structure the Information
Organize the information in a logical and meaningful way. Use visual elements such as lines, arrows, and symbols to show relationships between different concepts.
7.6. Add Visual Elements
Enhance your graphic organizer with visual elements such as colors, images, and icons. This can make it more engaging and easier to understand.
7.7. Review and Revise
Review your graphic organizer to ensure that it accurately represents the information you want to convey. Revise as needed to improve clarity and effectiveness.
8. Graphic Organizers in Education
Graphic organizers are widely used in education to enhance learning and improve student outcomes. Here are some specific applications:
8.1. Reading Comprehension
Graphic organizers can help students understand and retain information from texts by providing a visual framework for organizing key ideas, characters, and events.
8.2. Writing Process
Graphic organizers can aid in the writing process by helping students brainstorm ideas, organize their thoughts, and structure their essays or reports.
8.3. Mathematics
Graphic organizers can be used to solve math problems by visually representing the steps involved and helping students understand the relationships between different concepts.
8.4. Science
Graphic organizers can help students understand scientific concepts and processes by providing a visual framework for organizing information, conducting experiments, and analyzing data.
8.5. History
Graphic organizers can be used to teach history by visually representing historical events, timelines, and relationships between different people and places.
9. Graphic Organizers in Professional Settings
Graphic organizers are also valuable tools in professional settings for project management, strategic planning, and problem-solving. Here are some examples:
9.1. Project Management
Graphic organizers can help project managers plan, organize, and track project tasks, resources, and timelines.
9.2. Strategic Planning
Graphic organizers can aid in strategic planning by helping teams brainstorm ideas, analyze market trends, and develop effective strategies.
9.3. Brainstorming Sessions
Graphic organizers can facilitate brainstorming sessions by providing a visual framework for generating new ideas and exploring different perspectives.
9.4. Process Improvement
Graphic organizers can be used to analyze and improve business processes by visually representing the steps involved and identifying potential bottlenecks or inefficiencies.
10. Digital Tools for Creating Graphic Organizers
There are many digital tools available for creating graphic organizers. Here are some of the most popular options:
10.1. MindMeister
MindMeister is a web-based mind mapping tool that allows users to create, share, and collaborate on mind maps in real-time.
10.2. Lucidchart
Lucidchart is a visual collaboration platform that offers a wide range of diagramming and charting tools, including graphic organizers.
10.3. Canva
Canva is a graphic design platform that offers a variety of templates for creating graphic organizers, as well as tools for customizing designs.
10.4. Microsoft Visio
Microsoft Visio is a diagramming and vector graphics application that is part of the Microsoft Office suite. It offers a wide range of templates and tools for creating graphic organizers and other types of diagrams.
10.5. Google Drawings
Google Drawings is a free, web-based diagramming tool that is part of the Google Workspace suite. It allows users to create simple graphic organizers and diagrams.
11. Tips for Effective Use of Graphic Organizers
To maximize the benefits of graphic organizers, keep these tips in mind:
11.1. Keep it Simple
Avoid overcomplicating your graphic organizer with too much information or unnecessary details. Keep it simple and focused on the key concepts.
11.2. Use Color Strategically
Use color to highlight important information, differentiate between different categories, and make your graphic organizer more visually appealing.
11.3. Encourage Active Participation
Encourage active participation by involving learners in the creation of graphic organizers. This can help them better understand the information and retain it more effectively.
11.4. Provide Clear Instructions
Provide clear instructions on how to use the graphic organizer. Explain the purpose of each element and how they relate to one another.
11.5. Adapt to Individual Needs
Adapt your graphic organizers to the individual needs of your learners. Consider their learning styles, prior knowledge, and specific learning goals.
12. Common Mistakes to Avoid When Using Graphic Organizers
Avoid these common mistakes when using graphic organizers:
12.1. Overcomplicating the Design
Avoid adding too much information or unnecessary details to your graphic organizer. Keep it simple and focused on the key concepts.
12.2. Lack of Focus
Make sure your graphic organizer has a clear focus and purpose. Avoid including irrelevant information or straying from the main topic.
12.3. Ignoring the Audience
Consider your audience when creating a graphic organizer. Tailor the design and content to their specific needs and learning styles.
12.4. Insufficient Information
Ensure that your graphic organizer provides sufficient information to convey the key concepts and relationships you want to represent.
12.5. Not Reviewing the Final Product
Review your graphic organizer to ensure that it is accurate, clear, and effective. Revise as needed to improve its overall quality.
13. Real-World Examples of Graphic Organizers in Action
Here are some real-world examples of how graphic organizers can be used:
13.1. Planning a Marketing Campaign
A marketing team can use a mind map to brainstorm ideas for a new marketing campaign, exploring different strategies, target audiences, and messaging.
13.2. Designing a Website
A web designer can use a flowchart to plan the structure and navigation of a website, mapping out the different pages and how they relate to one another.
13.3. Analyzing a Literary Text
Students can use a concept map to analyze a literary text, exploring the themes, characters, and plot elements and how they relate to one another.
13.4. Organizing Research Data
Researchers can use a spider map to organize research data, categorizing findings and identifying patterns and relationships.
14. Future Trends in Graphic Organizers
The future of graphic organizers is likely to be shaped by emerging technologies and trends. Here are some potential developments:
14.1. Integration with AI
AI-powered tools could automate the creation of graphic organizers, suggesting relevant concepts, relationships, and visual elements based on the input data.
14.2. Virtual Reality Applications
Virtual reality could provide immersive environments for creating and interacting with graphic organizers, allowing users to explore complex concepts in a more engaging and intuitive way.
14.3. Personalized Learning
Graphic organizers could be personalized to individual learning styles and preferences, adapting to the learner’s needs and providing customized support.
15. Frequently Asked Questions (FAQs) About Graphic Organizers
Here are some frequently asked questions about graphic organizers:
| Question | Answer |
|---|---|
| What is the main purpose of a graphic organizer? | To visually represent information and relationships between concepts, making it easier to understand and remember. |
| Can graphic organizers be used in all subjects? | Yes, graphic organizers can be used in any subject area to enhance learning and improve outcomes. |
| Are graphic organizers only for visual learners? | No, while visual learners may find them particularly helpful, graphic organizers can benefit learners of all types by providing a structured approach to managing information. |
| What are some common types of graphic organizers? | Concept maps, mind maps, Venn diagrams, flowcharts, cause and effect diagrams, and timelines are some common types. |
| How do I choose the right type of graphic organizer? | Consider the nature of the information you want to represent and the purpose of your organizer. Choose the type that best suits your needs. |
| Can I create graphic organizers digitally? | Yes, there are many digital tools available for creating graphic organizers, such as MindMeister, Lucidchart, Canva, Microsoft Visio, and Google Drawings. |
| What are some tips for using graphic organizers effectively? | Keep it simple, use color strategically, encourage active participation, provide clear instructions, and adapt to individual needs. |
| What are some common mistakes to avoid? | Avoid overcomplicating the design, lacking focus, ignoring the audience, providing insufficient information, and not reviewing the final product. |
| Can graphic organizers be used in professional settings? | Yes, graphic organizers are valuable tools in professional settings for project management, strategic planning, brainstorming, and process improvement. |
| What are some future trends in graphic organizers? | Integration with AI, virtual reality applications, and personalized learning are some potential future trends. |
16. Conclusion
Graphic organizers are powerful tools that can enhance learning, improve comprehension, and boost creativity. Whether you’re a student, teacher, or professional, graphic organizers can help you organize your thoughts, solve problems, and achieve your goals. By understanding the different types of graphic organizers and how to use them effectively, you can unlock their full potential and transform the way you learn and work.
17. Call to Action
Ready to experience the benefits of graphic organizers for yourself? Visit WHAT.EDU.VN today to ask any question you have and discover a wide range of free resources and tools to help you get started. Our team of experts is here to provide personalized support and guidance to help you unlock your full potential.
Don’t let complex information overwhelm you. Embrace the power of visual learning and start organizing your thoughts with graphic organizers today! Contact us at 888 Question City Plaza, Seattle, WA 98101, United States, or reach out via Whatsapp at +1 (206) 555-7890. Let what.edu.vn be your guide to clear, concise, and effective visual learning.