ANOVA, or Analysis of Variance, is a powerful statistical tool. Discover its definition, types, practical uses, and examples at WHAT.EDU.VN. Are you struggling to understand how different groups compare in your research? ANOVA can provide the answers. Unlock the secrets of variance analysis and gain actionable insights! Explore hypothesis testing, variance within groups, and statistical significance.
1. Understanding ANOVA: The Basics
ANOVA, short for Analysis of Variance, is a statistical test used to determine if there are significant differences between the means of two or more groups. It’s a versatile tool widely used in research and data analysis across various fields. At its core, ANOVA helps us understand how different factors or treatments affect a particular outcome. This technique is invaluable when you need to compare multiple groups simultaneously, offering a more efficient approach than running multiple t-tests. It assesses whether the variability within each group is small compared to the variability between the groups.
1.1. What is Analysis of Variance?
Analysis of Variance (ANOVA) examines differences between group means by partitioning the variance in a dataset. Instead of comparing each group directly, ANOVA analyzes the variance within each group and compares it to the variance between the groups. If the variance between groups is significantly larger than the variance within groups, it suggests that there is a significant difference between the means of at least two groups. In essence, ANOVA helps determine if the observed differences in group means are statistically significant or simply due to random chance.
1.2. The Core Principle: Analyzing Variance
The primary principle behind ANOVA is partitioning the total variance in a dataset into different sources of variation. These sources include variance within each group (also known as error variance) and variance between the groups (treatment variance). By comparing the magnitude of these variances, ANOVA determines whether the differences between group means are statistically significant. The larger the treatment variance relative to the error variance, the stronger the evidence against the null hypothesis of equal means. This allows researchers to make informed decisions about the effects of different treatments or factors on the outcome variable.
1.3. ANOVA vs. T-tests: When to Use Which
While both ANOVA and t-tests are used to compare means, they are suited for different situations. A t-test is used to compare the means of only two groups. When you have three or more groups to compare, ANOVA is the more appropriate choice. Running multiple t-tests increases the risk of Type I error (false positive), whereas ANOVA controls for this risk by comparing all groups simultaneously. Therefore, ANOVA provides a more accurate and efficient way to analyze differences between multiple groups.
1.4. Key Terminology in ANOVA
Familiarizing yourself with key terminology is essential for understanding ANOVA. These terms include:
- Independent Variable (Factor): The variable that is manipulated or controlled by the researcher to observe its effect on the dependent variable.
- Dependent Variable: The variable that is measured or observed in response to changes in the independent variable.
- Levels: The different categories or groups within the independent variable.
- Treatment: A specific combination of levels of the independent variable(s).
- Null Hypothesis: The hypothesis that there is no significant difference between the means of the groups.
- Alternative Hypothesis: The hypothesis that there is a significant difference between the means of at least two groups.
- F-statistic: The test statistic used in ANOVA to determine the significance of the differences between group means.
- P-value: The probability of obtaining results as extreme as or more extreme than the observed results, assuming the null hypothesis is true.
1.5. The Goal of ANOVA: Determining Significance
The ultimate goal of ANOVA is to determine whether the observed differences between the means of different groups are statistically significant. In other words, ANOVA helps us decide if the differences are likely due to a real effect of the independent variable or simply due to random chance. By calculating the F-statistic and associated p-value, researchers can assess the strength of the evidence against the null hypothesis and make informed decisions about the relationships between variables.
2. Types of ANOVA: Choosing the Right Test
There are several types of ANOVA, each designed for different research scenarios. Understanding the distinctions between these types is crucial for selecting the appropriate test for your data.
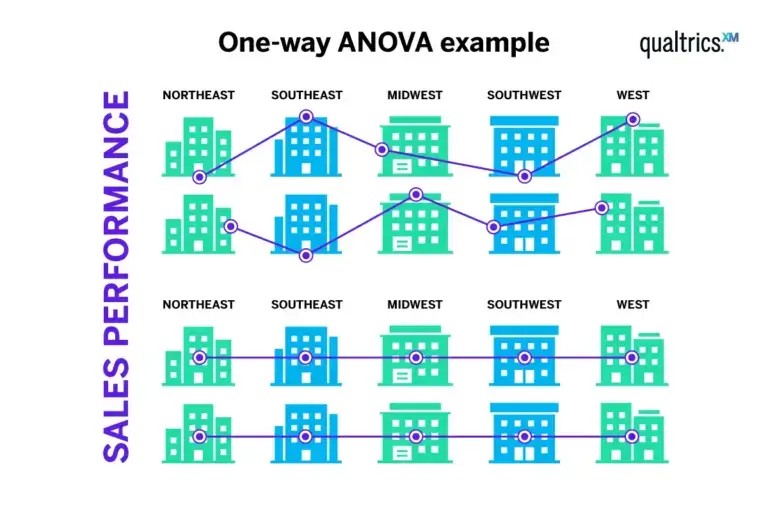
2.1. One-Way ANOVA: Comparing Groups on One Factor
One-Way ANOVA is used when you have one independent variable (factor) with three or more levels and want to compare the means of the groups defined by these levels. For instance, you might use a one-way ANOVA to compare the effectiveness of three different teaching methods on student test scores. The key characteristic of one-way ANOVA is that it only considers one factor in explaining the variation in the dependent variable.
2.2. Two-Way ANOVA: Examining Two Factors and Their Interaction
Two-Way ANOVA is used when you have two independent variables (factors) and want to examine their individual and combined effects on the dependent variable. This type of ANOVA allows you to assess not only the main effects of each factor but also the interaction effect between them. For example, you could use a two-way ANOVA to study the effects of both exercise (factor 1) and diet (factor 2) on weight loss. The interaction effect would reveal whether the effect of exercise on weight loss depends on the type of diet.
2.3. Factorial ANOVA: Handling Multiple Factors
Factorial ANOVA is an extension of two-way ANOVA that can handle more than two independent variables. It allows you to examine the main effects of each factor as well as all possible interaction effects between them. This type of ANOVA is useful when you want to understand the complex relationships between multiple factors and their impact on the outcome variable. For instance, you might use a factorial ANOVA to study the effects of age, gender, and education level on income.
2.4. Repeated Measures ANOVA: Analyzing Changes Over Time
Repeated Measures ANOVA is used when you have measurements taken on the same subjects over multiple time points or under different conditions. This type of ANOVA is appropriate when you want to assess changes within subjects rather than between subjects. For example, you could use a repeated measures ANOVA to study the effect of a drug on blood pressure, measuring blood pressure on the same patients before, during, and after treatment.
2.5. MANOVA: Dealing with Multiple Dependent Variables
Multivariate Analysis of Variance (MANOVA) is used when you have multiple dependent variables that are related to each other. MANOVA allows you to examine the effects of one or more independent variables on the set of dependent variables as a whole. This type of ANOVA is useful when you want to understand how different factors influence a combination of outcomes. For example, you might use a MANOVA to study the effects of different training programs on both employee productivity and job satisfaction.
3. How ANOVA Works: A Step-by-Step Guide
To fully grasp the power of ANOVA, it’s essential to understand the underlying steps involved in the analysis. Here’s a step-by-step guide to how ANOVA works.
3.1. Stating the Hypotheses: Null and Alternative
The first step in ANOVA is to state the null and alternative hypotheses. The null hypothesis typically states that there is no significant difference between the means of the groups being compared. The alternative hypothesis states that there is a significant difference between at least two of the group means. For example, if you are comparing the effectiveness of three different fertilizers on plant growth, the null hypothesis would be that there is no difference in average plant height between the fertilizers, and the alternative hypothesis would be that there is a difference.
3.2. Calculating the Sum of Squares: Partitioning the Variance
The next step is to calculate the sum of squares, which involves partitioning the total variance in the data into different sources of variation. This includes:
- Sum of Squares Total (SST): Measures the total variability in the data.
- Sum of Squares Between (SSB): Measures the variability between the group means.
- Sum of Squares Within (SSW): Measures the variability within each group.
The formula for partitioning the variance is SST = SSB + SSW.
3.3. Determining Degrees of Freedom: Understanding the Sample Size
Degrees of freedom (df) refer to the number of independent pieces of information used to calculate a statistic. In ANOVA, you need to determine the degrees of freedom for each source of variation. The degrees of freedom for SSB is the number of groups minus 1 (k – 1), and the degrees of freedom for SSW is the total sample size minus the number of groups (N – k).
3.4. Computing Mean Squares: Adjusting for Degrees of Freedom
Mean squares (MS) are calculated by dividing the sum of squares by the corresponding degrees of freedom. This adjustment accounts for the sample size and the number of groups in the analysis. The mean square between (MSB) is calculated as SSB / (k – 1), and the mean square within (MSW) is calculated as SSW / (N – k).
3.5. Calculating the F-statistic: Comparing Variance Between and Within Groups
The F-statistic is calculated by dividing the mean square between (MSB) by the mean square within (MSW). The F-statistic represents the ratio of the variance between groups to the variance within groups. A larger F-statistic indicates a greater difference between the group means relative to the variability within each group.
3.6. Determining the P-value: Assessing Statistical Significance
The p-value is the probability of obtaining results as extreme as or more extreme than the observed results, assuming the null hypothesis is true. The p-value is determined by comparing the F-statistic to an F-distribution with the appropriate degrees of freedom. A small p-value (typically less than 0.05) indicates strong evidence against the null hypothesis, suggesting that there is a significant difference between the group means.
3.7. Making a Decision: Rejecting or Failing to Reject the Null Hypothesis
Based on the p-value, you make a decision about whether to reject or fail to reject the null hypothesis. If the p-value is less than the chosen significance level (alpha), you reject the null hypothesis and conclude that there is a significant difference between the group means. If the p-value is greater than alpha, you fail to reject the null hypothesis and conclude that there is not enough evidence to support a significant difference.
3.8. Post-Hoc Tests: Pinpointing the Differences
If you reject the null hypothesis in ANOVA, it means that there is a significant difference between at least two of the group means, but it doesn’t tell you which specific groups are different from each other. To determine which groups are significantly different, you need to perform post-hoc tests. Common post-hoc tests include Tukey’s HSD, Bonferroni, and Scheffe’s test.
4. Real-World Applications of ANOVA: Practical Examples
ANOVA is a powerful tool with a wide range of applications across various fields. Here are some practical examples of how ANOVA can be used in different contexts.
4.1. Business: Analyzing Marketing Campaign Effectiveness
In business, ANOVA can be used to analyze the effectiveness of different marketing campaigns. For example, a company might run three different advertising campaigns and want to determine which campaign leads to the highest sales. By using ANOVA, the company can compare the average sales generated by each campaign and determine if there is a statistically significant difference between them.
4.2. Healthcare: Comparing Treatment Outcomes
In healthcare, ANOVA can be used to compare the outcomes of different treatments. For example, researchers might want to compare the effectiveness of three different drugs in treating a particular condition. By using ANOVA, they can compare the average improvement in symptoms for each drug and determine if there is a statistically significant difference between them.
4.3. Education: Evaluating Teaching Methods
In education, ANOVA can be used to evaluate the effectiveness of different teaching methods. For example, a school might implement two different teaching approaches and want to determine which method leads to the highest student performance. By using ANOVA, the school can compare the average test scores of students in each teaching method and determine if there is a statistically significant difference between them.
4.4. Psychology: Studying the Impact of Interventions
In psychology, ANOVA can be used to study the impact of different interventions on behavior. For example, researchers might want to compare the effects of three different therapy techniques on reducing anxiety. By using ANOVA, they can compare the average reduction in anxiety scores for each therapy technique and determine if there is a statistically significant difference between them.
4.5. Agriculture: Optimizing Crop Yield
In agriculture, ANOVA can be used to optimize crop yield. For example, farmers might want to compare the effects of four different fertilizers on plant growth. By using ANOVA, they can compare the average crop yield for each fertilizer and determine if there is a statistically significant difference between them, helping them select the fertilizer that leads to the highest yield.
 Different crops and fertilizers
5. Assumptions of ANOVA: Ensuring Valid Results
ANOVA relies on several key assumptions to ensure that the results are valid and reliable. It’s crucial to check these assumptions before interpreting the results of your ANOVA.
5.1. Normality: Data Follows a Normal Distribution
The assumption of normality requires that the data within each group follows a normal distribution. This means that the values are symmetrically distributed around the mean, with most values clustered close to the mean and fewer values in the tails. You can check this assumption by creating histograms or Q-Q plots of the data within each group.
5.2. Homogeneity of Variance: Groups Have Equal Variance
The assumption of homogeneity of variance requires that the groups being compared have equal variances. This means that the spread or dispersion of the data is similar across all groups. You can check this assumption using Levene’s test or Bartlett’s test.
5.3. Independence: Observations Are Independent
The assumption of independence requires that the observations within each group are independent of each other. This means that the value of one observation does not influence the value of any other observation. You can ensure independence by using random sampling and avoiding any systematic relationships between the observations.
5.4. Addressing Violations: What to Do When Assumptions Are Not Met
If one or more of the assumptions of ANOVA are violated, you may need to use alternative statistical techniques or transformations. For example, if the data are not normally distributed, you might try transforming the data using a logarithmic or square root transformation. If the variances are not equal, you might use a Welch’s ANOVA, which does not assume equal variances. If the observations are not independent, you might need to use a mixed-effects model that accounts for the dependence.
6. Advantages and Disadvantages of ANOVA: Weighing the Pros and Cons
Like any statistical technique, ANOVA has its strengths and limitations. Understanding these advantages and disadvantages can help you decide if ANOVA is the right tool for your research question.
6.1. Strengths of ANOVA: Why Choose ANOVA?
- Multiple Group Comparisons: ANOVA allows you to compare the means of three or more groups simultaneously, which is more efficient than running multiple t-tests.
- Control for Type I Error: ANOVA controls for the risk of Type I error (false positive) by comparing all groups simultaneously.
- Versatility: ANOVA is a versatile technique that can be used in a wide range of research scenarios.
- Examination of Interactions: Two-way and factorial ANOVA allow you to examine the interaction effects between multiple factors.
6.2. Limitations of ANOVA: Considerations Before Use
- Assumptions: ANOVA relies on several key assumptions, which must be met for the results to be valid.
- Post-Hoc Testing: If you reject the null hypothesis in ANOVA, you need to perform post-hoc tests to determine which specific groups are different, adding an extra step to the analysis.
- Complexity: ANOVA can be more complex than simpler techniques like t-tests, requiring a deeper understanding of statistical principles.
- Sensitivity to Outliers: ANOVA can be sensitive to outliers, which can distort the results.
7. ANOVA in Statistical Software: Tools for Analysis
Conducting ANOVA manually can be time-consuming and prone to errors. Fortunately, there are several statistical software packages available that make it easier to perform ANOVA and interpret the results.
7.1. SPSS: A Comprehensive Statistical Package
SPSS (Statistical Package for the Social Sciences) is a widely used statistical software package that offers a comprehensive set of tools for data analysis, including ANOVA. SPSS provides a user-friendly interface and detailed output that helps you interpret the results of your ANOVA.
7.2. R: A Powerful Open-Source Language
R is a powerful open-source programming language that is widely used in statistics and data analysis. R offers a wide range of packages for performing ANOVA and other statistical techniques. While R requires some programming knowledge, it provides greater flexibility and control over your analysis.
7.3. SAS: A Robust Statistical System
SAS (Statistical Analysis System) is a robust statistical software system that is widely used in business and industry. SAS offers a comprehensive set of tools for data analysis, including ANOVA. SAS is known for its reliability and ability to handle large datasets.
7.4. Excel: Basic ANOVA Capabilities
Excel also provides basic ANOVA capabilities through its Analysis ToolPak add-in. While Excel is not as powerful as dedicated statistical software packages, it can be useful for performing simple ANOVA analyses on smaller datasets.
8. Interpreting ANOVA Results: Making Sense of the Output
Once you have performed ANOVA using statistical software, you need to interpret the results to draw meaningful conclusions. Here’s how to make sense of the ANOVA output.
8.1. Understanding the ANOVA Table: Key Components
The ANOVA table summarizes the results of your ANOVA analysis. Key components of the ANOVA table include:
- Source of Variation: Indicates the different sources of variation in the data (e.g., between groups, within groups).
- Sum of Squares: Measures the amount of variation attributed to each source.
- Degrees of Freedom: Indicates the number of independent pieces of information used to calculate each statistic.
- Mean Square: Calculated by dividing the sum of squares by the degrees of freedom.
- F-statistic: Represents the ratio of the variance between groups to the variance within groups.
- P-value: Indicates the probability of obtaining results as extreme as or more extreme than the observed results, assuming the null hypothesis is true.
8.2. The F-statistic and P-value: Determining Significance
The F-statistic and p-value are the most important values in the ANOVA table. The F-statistic measures the ratio of the variance between groups to the variance within groups, while the p-value indicates the probability of obtaining results as extreme as or more extreme than the observed results, assuming the null hypothesis is true. If the p-value is less than your chosen significance level (alpha), you reject the null hypothesis and conclude that there is a significant difference between the group means.
8.3. Post-Hoc Tests: Identifying Group Differences
If you reject the null hypothesis in ANOVA, you need to perform post-hoc tests to determine which specific groups are significantly different from each other. Common post-hoc tests include Tukey’s HSD, Bonferroni, and Scheffe’s test. Each post-hoc test has its own strengths and weaknesses, so it’s important to choose the test that is most appropriate for your data and research question.
8.4. Effect Size: Measuring the Magnitude of the Effect
In addition to determining statistical significance, it’s also important to measure the effect size, which indicates the magnitude of the effect. Common measures of effect size in ANOVA include eta-squared (η²) and partial eta-squared (ηp²). These measures indicate the proportion of variance in the dependent variable that is explained by the independent variable.
9. FAQ: Answering Your Questions About ANOVA
Here are some frequently asked questions about ANOVA, along with detailed answers to help you deepen your understanding.
9.1. What is the difference between ANOVA and t-tests?
ANOVA and t-tests are both used to compare means, but they are suited for different situations. A t-test is used to compare the means of only two groups, while ANOVA is used to compare the means of three or more groups. Additionally, running multiple t-tests increases the risk of Type I error, whereas ANOVA controls for this risk.
9.2. What are the assumptions of ANOVA?
The assumptions of ANOVA include normality, homogeneity of variance, and independence. Normality requires that the data within each group follows a normal distribution, homogeneity of variance requires that the groups have equal variances, and independence requires that the observations are independent of each other.
9.3. What if the assumptions of ANOVA are violated?
If the assumptions of ANOVA are violated, you may need to use alternative statistical techniques or transformations. For example, if the data are not normally distributed, you might try transforming the data using a logarithmic or square root transformation. If the variances are not equal, you might use a Welch’s ANOVA. If the observations are not independent, you might need to use a mixed-effects model.
9.4. What are post-hoc tests and when should I use them?
Post-hoc tests are used after you have rejected the null hypothesis in ANOVA to determine which specific groups are significantly different from each other. Common post-hoc tests include Tukey’s HSD, Bonferroni, and Scheffe’s test. You should use post-hoc tests whenever you reject the null hypothesis in ANOVA.
9.5. How do I interpret the F-statistic and p-value in ANOVA?
The F-statistic measures the ratio of the variance between groups to the variance within groups, while the p-value indicates the probability of obtaining results as extreme as or more extreme than the observed results, assuming the null hypothesis is true. If the p-value is less than your chosen significance level (alpha), you reject the null hypothesis and conclude that there is a significant difference between the group means.
10. Conclusion: Mastering ANOVA for Data Analysis
ANOVA is a powerful and versatile statistical technique that allows you to compare the means of three or more groups simultaneously. By understanding the principles, types, steps, assumptions, and applications of ANOVA, you can effectively use this tool to analyze data and draw meaningful conclusions.
Are you ready to put your knowledge into practice? Visit what.edu.vn to ask any questions you may have and receive free, expert guidance. Don’t let data analysis challenges hold you back—unlock the power of ANOVA and transform your research! For further assistance, contact us at 888 Question City Plaza, Seattle, WA 98101, United States, or via WhatsApp at +1 (206) 555-7890.