Standard deviation, a critical statistical measure, reveals the amount of dispersion within a set of values. It helps in understanding data variability. At WHAT.EDU.VN, we aim to demystify this concept, offering a straightforward explanation alongside its applications in various fields. Dive in to understand data distribution, variance, and statistical analysis.
1. Understanding Standard Deviation: The Basics
Standard deviation is more than just a number; it’s a key to understanding how data spreads around its average. It quantifies the variability in a dataset. The importance of standard deviation lies in its ability to offer insights into data reliability and predictability.
1.1. Definition of Standard Deviation
Standard deviation measures the extent to which individual data points deviate from the mean. A low standard deviation suggests that the data points are clustered closely around the mean, while a high standard deviation indicates that they are more spread out. The formula, though it might seem complex, is designed to capture this dispersion accurately.
1.2. Standard Deviation vs. Variance
Variance and standard deviation are closely related, but they provide different perspectives on data dispersion. Variance is the average of the squared differences from the mean, providing a general sense of variability. Standard deviation, on the other hand, is the square root of the variance. It brings the measure back into the original units of the data, making it easier to interpret. For example, if you’re measuring heights in inches, the standard deviation will also be in inches, whereas the variance would be in square inches.
1.3. Why Standard Deviation Matters
Standard deviation helps in risk assessment, quality control, and making informed decisions. It’s a fundamental tool in statistics for data analysis. Understanding it allows for better interpretations of data trends and patterns.
2. Calculating Standard Deviation: Step-by-Step
Calculating standard deviation might seem daunting, but breaking it down into steps makes it manageable. The key is to understand each component of the formula and what it represents. Let’s walk through the process with clear explanations and examples.
2.1. The Standard Deviation Formula Explained
The formula for standard deviation is:
σ = √[ Σ (xi – µ)² / (N – 1) ]
Where:
- σ = standard deviation
- xi = each individual data point
- µ = the mean of the data
- N = the number of data points
This formula calculates how much each data point differs from the mean, squares those differences, sums them up, divides by the number of data points (minus one for sample standard deviation), and then takes the square root to get the standard deviation.
2.2. Steps to Calculate Standard Deviation
- Calculate the Mean: Add up all the data points and divide by the number of data points.
- Find the Variance: Subtract the mean from each data point, square the result, and then find the average of these squared differences.
- Find the Standard Deviation: Take the square root of the variance.
2.3. Example Calculation
Let’s say we have the following dataset: 4, 7, 10, 15, 20.
- Calculate the Mean: (4 + 7 + 10 + 15 + 20) / 5 = 11.2
- Find the Variance:
- (4 – 11.2)² = 51.84
- (7 – 11.2)² = 17.64
- (10 – 11.2)² = 1.44
- (15 – 11.2)² = 14.44
- (20 – 11.2)² = 77.44
- Sum of squares = 51.84 + 17.64 + 1.44 + 14.44 + 77.44 = 162.8
- Variance = 162.8 / (5 – 1) = 40.7
- Find the Standard Deviation: √40.7 = 6.38
2.4. Population vs. Sample Standard Deviation
There are two types of standard deviation: population and sample. Population standard deviation considers the entire group, while sample standard deviation is calculated from a subset of the population. The formula differs slightly:
- Population Standard Deviation: σ = √[ Σ (xi – µ)² / N ]
- Sample Standard Deviation: s = √[ Σ (xi – x̄)² / (n – 1) ]
Using (n – 1) in the sample standard deviation provides an unbiased estimate of the population standard deviation.
3. Interpreting Standard Deviation: What Does It Tell You?
Once you’ve calculated the standard deviation, it’s crucial to interpret what the number actually means. It provides insights into the spread of your data and its implications. Understanding how to interpret it will help you make informed decisions based on your data analysis.
3.1. High vs. Low Standard Deviation
- High Standard Deviation: A high standard deviation indicates that data points are widely dispersed from the mean. This can mean that there is a lot of variability in the data, which might indicate higher risk or uncertainty.
- Low Standard Deviation: A low standard deviation indicates that data points are clustered closely around the mean. This suggests that the data is more consistent and predictable.
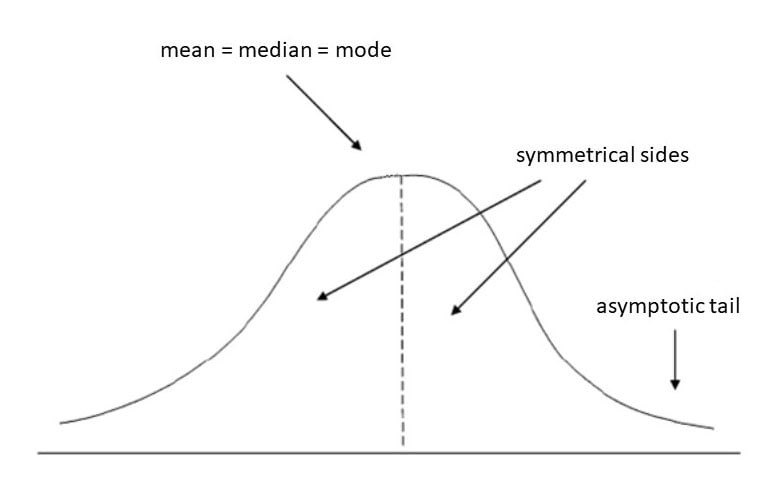
3.2. Standard Deviation and the Normal Distribution
In a normal distribution, standard deviation plays a key role in understanding the distribution of data.
- 68-95-99.7 Rule: Approximately 68% of the data falls within one standard deviation of the mean, 95% falls within two standard deviations, and 99.7% falls within three standard deviations.
This rule helps to quickly assess the range in which most of the data lies and identify potential outliers.
3.3. Real-World Examples of Interpretation
- Finance: In finance, a high standard deviation in stock returns indicates higher volatility and risk.
- Manufacturing: In manufacturing, a low standard deviation in product dimensions indicates higher consistency and quality.
- Education: In education, a low standard deviation in test scores indicates that students are performing at a similar level.
4. Applications of Standard Deviation Across Industries
Standard deviation isn’t confined to textbooks; it’s a powerful tool with numerous practical applications. From finance to healthcare, understanding standard deviation can provide valuable insights and improve decision-making. Let’s explore some key applications across different industries.
4.1. Finance
In finance, standard deviation is used to measure the volatility or risk associated with an investment. A high standard deviation indicates that the investment’s returns are likely to fluctuate significantly, meaning it is riskier.
- Risk Assessment: Investors use standard deviation to assess the potential risks of different investments.
- Portfolio Management: Portfolio managers use standard deviation to diversify portfolios and manage risk.
4.2. Healthcare
In healthcare, standard deviation helps in assessing the variability in patient data, such as blood pressure, cholesterol levels, or treatment outcomes.
- Clinical Trials: Standard deviation is used to determine the effectiveness and consistency of new treatments.
- Quality Control: Hospitals use standard deviation to monitor and improve the quality of patient care.
4.3. Manufacturing
In manufacturing, standard deviation is used to monitor the consistency and quality of products. A low standard deviation indicates that the products are uniform and meet quality standards.
- Quality Control: Manufacturers use standard deviation to ensure that products meet specified dimensions and tolerances.
- Process Improvement: By monitoring standard deviation, manufacturers can identify and address inconsistencies in the production process.
4.4. Education
In education, standard deviation helps in understanding the distribution of student performance on tests and assessments.
- Performance Evaluation: Educators use standard deviation to assess the variability in student scores and identify areas for improvement.
- Curriculum Development: By analyzing standard deviation, educators can tailor curriculum to meet the needs of diverse learners.
 A graph illustrating the applications of standard deviation in various fields like finance, healthcare, manufacturing, and education, emphasizing its role in risk assessment, quality control, and performance evaluation.
5. Advantages and Disadvantages of Using Standard Deviation
Like any statistical measure, standard deviation has its strengths and weaknesses. Understanding these advantages and disadvantages can help you use it effectively and avoid potential pitfalls. Let’s take a closer look.
5.1. Advantages
- Clear Measurement of Variability: Standard deviation provides a clear and quantifiable measure of data dispersion.
- Ease of Interpretation: It is relatively easy to interpret, especially in the context of a normal distribution.
- Wide Applicability: Standard deviation can be applied across various fields, making it a versatile tool for data analysis.
- Foundation for Further Analysis: It serves as a foundation for more advanced statistical analyses, such as hypothesis testing and regression analysis.
5.2. Disadvantages
- Sensitivity to Outliers: Standard deviation is highly sensitive to extreme values or outliers, which can distort the measure of dispersion.
- Assumption of Normality: It assumes that the data follows a normal distribution, which may not always be the case.
- Complexity for Large Datasets: Calculating standard deviation can be complex and time-consuming for large datasets without the aid of statistical software.
- Limited Information: Standard deviation only provides information about the spread of data, not its shape or central tendency.
6. Tools and Technologies for Calculating Standard Deviation
Calculating standard deviation by hand can be tedious, especially with large datasets. Fortunately, various tools and technologies can simplify the process. Here are some popular options that make calculating standard deviation easier and more efficient.
6.1. Microsoft Excel
Microsoft Excel is a widely used spreadsheet program that includes built-in functions for calculating standard deviation.
- STDEV.P: Calculates the standard deviation for a population.
- STDEV.S: Calculates the standard deviation for a sample.
To use these functions, simply enter your data into a column or row and then use the appropriate function to calculate the standard deviation.
6.2. Google Sheets
Google Sheets is a free, web-based spreadsheet program that offers similar functionality to Microsoft Excel.
- STDEVP: Calculates the standard deviation for a population.
- STDEV: Calculates the standard deviation for a sample.
Like Excel, Google Sheets makes it easy to calculate standard deviation with just a few clicks.
6.3. Python with NumPy
Python, along with the NumPy library, provides powerful tools for statistical analysis.
- numpy.std(): Calculates the standard deviation of an array.
NumPy is particularly useful for working with large datasets and performing more complex statistical analyses.
6.4. R Programming
R is a programming language specifically designed for statistical computing and graphics.
- sd(): Calculates the standard deviation of a vector.
R offers a wide range of statistical functions and packages, making it a popular choice for statisticians and data scientists.
7. Common Mistakes to Avoid When Calculating Standard Deviation
Calculating standard deviation can be tricky, and it’s easy to make mistakes if you’re not careful. Avoiding these common pitfalls can help you ensure accurate and reliable results. Let’s look at some mistakes to watch out for.
7.1. Using the Wrong Formula
One of the most common mistakes is using the wrong formula for population vs. sample standard deviation.
- Population: Use the population formula when you have data for the entire group you’re interested in.
- Sample: Use the sample formula when you have data for a subset of the group and are trying to estimate the standard deviation for the entire population.
7.2. Incorrectly Calculating the Mean
The mean is a critical component of the standard deviation formula. An error in calculating the mean will propagate through the rest of the calculation, leading to an incorrect standard deviation.
- Double-Check: Always double-check your calculations to ensure the mean is accurate.
- Use Software: Use software tools like Excel or Python to avoid manual calculation errors.
7.3. Misunderstanding the Data
It’s important to understand the data you’re working with and whether it meets the assumptions of the standard deviation calculation.
- Outliers: Be aware of outliers that can significantly impact the standard deviation.
- Distribution: Consider whether the data follows a normal distribution. If not, standard deviation may not be the most appropriate measure of dispersion.
7.4. Errors in Squaring and Square Rooting
Squaring the differences from the mean and taking the square root are key steps in the standard deviation calculation. Errors in these steps can lead to incorrect results.
- Accuracy: Pay close attention when performing these calculations, especially manually.
- Software: Use software tools to automate these steps and reduce the risk of errors.
8. Standard Deviation in Different Fields: Case Studies
Standard deviation is a versatile tool used across various fields. Examining specific case studies can illustrate its practical applications and importance in real-world scenarios. Let’s explore how standard deviation is used in different industries.
8.1. Finance: Analyzing Stock Volatility
In finance, standard deviation is used to measure the volatility of stock prices. A high standard deviation indicates that the stock price is highly volatile, meaning it can fluctuate significantly over a short period.
- Case Study: Consider two stocks, Stock A and Stock B. Stock A has an average return of 10% with a standard deviation of 5%, while Stock B has an average return of 12% with a standard deviation of 15%. While Stock B offers a higher average return, it also carries significantly more risk due to its higher standard deviation. Investors might choose Stock A if they prefer lower risk, even though the potential return is slightly lower.
8.2. Healthcare: Evaluating Treatment Effectiveness
In healthcare, standard deviation helps in evaluating the effectiveness of medical treatments. By comparing the standard deviation of treatment outcomes, researchers can determine if a treatment is consistently effective.
- Case Study: A clinical trial tests a new drug designed to lower blood pressure. The trial finds that the average reduction in blood pressure is 15 mmHg with a standard deviation of 3 mmHg. This low standard deviation suggests that the drug is consistently effective in lowering blood pressure across the patient population.
8.3. Manufacturing: Ensuring Product Quality
In manufacturing, standard deviation is used to ensure the quality and consistency of products. By monitoring the standard deviation of product dimensions, manufacturers can identify and correct any inconsistencies in the production process.
- Case Study: A company produces bolts with a target diameter of 10 mm. The quality control process measures the diameter of a sample of bolts and finds that the average diameter is 10.01 mm with a standard deviation of 0.02 mm. The low standard deviation indicates that the production process is well-controlled and consistently produces bolts that meet the required specifications.
8.4. Education: Assessing Student Performance
In education, standard deviation helps in assessing the performance of students on standardized tests. By analyzing the standard deviation of test scores, educators can understand the distribution of student performance and identify areas for improvement.
- Case Study: A school administers a standardized math test to its students. The average score is 75 with a standard deviation of 10. This standard deviation provides insight into the range of student performance, helping teachers identify students who may need additional support or enrichment.
9. Advanced Concepts Related to Standard Deviation
While understanding the basics of standard deviation is essential, delving into advanced concepts can provide a deeper understanding of its applications and limitations. Let’s explore some of these advanced topics.
9.1. Chebyshev’s Inequality
Chebyshev’s Inequality provides a way to estimate the proportion of data that falls within a certain number of standard deviations from the mean, even if the data is not normally distributed.
- Formula: P(|X – μ| ≥ kσ) ≤ 1/k²
This inequality states that no more than 1/k² of the distribution’s values can be more than k standard deviations away from the mean.
9.2. Coefficient of Variation
The Coefficient of Variation (CV) is a measure of relative variability. It is calculated as the ratio of the standard deviation to the mean.
- Formula: CV = σ / μ
The CV is useful when comparing the variability of datasets with different means or different units of measurement.
9.3. Standard Error
The Standard Error (SE) is the standard deviation of the sampling distribution of a statistic. It measures the accuracy with which a sample represents a population.
- Formula: SE = σ / √n
Where:
- σ = population standard deviation
- n = sample size
9.4. Skewness and Kurtosis
Skewness and kurtosis are measures that describe the shape of a distribution.
- Skewness: Measures the asymmetry of the distribution. A skewness of zero indicates a perfectly symmetrical distribution.
- Kurtosis: Measures the “tailedness” of the distribution. High kurtosis indicates heavy tails, while low kurtosis indicates light tails.
10. FAQ: Standard Deviation
10.1. What is a good standard deviation?
The “goodness” of a standard deviation depends on the context and the specific data being analyzed. In some cases, a low standard deviation is desirable, indicating consistency and reliability. In other cases, a higher standard deviation may be acceptable or even expected, reflecting natural variability in the data.
10.2. Can standard deviation be negative?
No, standard deviation cannot be negative. It is always a non-negative value because it is calculated as the square root of the variance, which is the average of the squared differences from the mean.
10.3. What does a standard deviation of zero mean?
A standard deviation of zero indicates that all data points in the dataset are identical. There is no variability in the data, and every value is equal to the mean.
10.4. How does sample size affect standard deviation?
The sample size can affect the accuracy of the standard deviation estimate. Larger sample sizes generally provide more accurate estimates of the population standard deviation.
10.5. Is standard deviation affected by outliers?
Yes, standard deviation is highly sensitive to outliers. Outliers can significantly increase the standard deviation, making the data appear more variable than it actually is.
10.6. Can standard deviation be greater than the mean?
Yes, standard deviation can be greater than the mean, especially in datasets with high variability or skewed distributions.
10.7. How is standard deviation used in hypothesis testing?
Standard deviation is used in hypothesis testing to calculate test statistics and determine the significance of results. It helps to assess the variability in the data and determine whether observed differences are statistically significant.
10.8. What is the relationship between standard deviation and confidence intervals?
Standard deviation is used to calculate confidence intervals, which provide a range of values within which the true population parameter is likely to fall. The standard deviation helps to determine the width of the confidence interval.
10.9. How do I calculate standard deviation for grouped data?
To calculate standard deviation for grouped data, you need to use the midpoint of each class interval and the frequency of each interval. Use the formula:
σ = √[ Σ (fi * (mi – μ)²) / N ]
Where:
- fi = frequency of each interval
- mi = midpoint of each interval
- μ = mean of the grouped data
- N = total number of data points
10.10. What are some alternatives to standard deviation?
Alternatives to standard deviation include:
- Variance: The average of the squared differences from the mean.
- Interquartile Range (IQR): The range between the first and third quartiles, which is less sensitive to outliers.
- Mean Absolute Deviation (MAD): The average of the absolute differences from the mean.
Standard deviation is an indispensable tool for understanding data dispersion and variability. Whether you’re in finance, healthcare, manufacturing, or education, grasping its principles can greatly enhance your data analysis and decision-making. By understanding its calculation, interpretation, and applications, you can unlock valuable insights from your data.
Still have questions about standard deviation or other statistical concepts? Don’t hesitate to ask your questions on WHAT.EDU.VN for free answers and expert insights. Our community is here to help you navigate the complexities of data analysis and statistics. Contact us at 888 Question City Plaza, Seattle, WA 98101, United States. Whatsapp: +1 (206) 555-7890. Or visit our website: what.edu.vn.