It’s a question we often ask daily: “What’s the temperature right now?” Whether you’re planning your outfit, deciding on outdoor activities, or simply curious, knowing the current temperature is a common need. But when we zoom out and look at the bigger picture, understanding global temperatures becomes crucial, especially in the context of climate change. While your local weather app tells you the temperature in your city, scientists are tracking something far more significant: the Earth’s average surface temperature. This global average, though seemingly abstract, is a vital sign of our planet’s health.
To grasp what the temperature is “right now” on a global scale, it’s important to understand that it’s not about a single reading. Earth’s temperature varies dramatically across locations and times. At any moment, temperatures can swing more than 100°F (55°C) between the hottest and coldest places. There’s the daily cycle of night and day, and the seasonal shifts between hemispheres. So, talking about an “average” global temperature might seem strange. However, this average is incredibly useful for tracking changes in Earth’s overall energy balance – the difference between incoming sunlight and outgoing heat radiated back into space. This balance is what dictates our planet’s climate, and even small changes in the average global surface temperature can have significant consequences.
To calculate this global average temperature, scientists start with temperature measurements from thousands of locations around the world, both on land and sea. To focus on temperature changes over time, they convert absolute readings into temperature anomalies. These anomalies represent the difference between the observed temperature and the long-term average for that specific location and date. Imagine comparing today’s temperature in your city not to zero, but to the average temperature for this day of the year over many decades. This anomaly approach helps to smooth out local variations and highlight the broader trends. Independent research groups worldwide analyze this data, and remarkably, they all consistently show a similar upward trend in global temperatures.
In areas with fewer direct measurements, especially remote oceans or polar regions, scientists use statistical methods and data from nearby locations to estimate temperatures. These values are then combined to calculate the global average temperature. This rigorous process provides a reliable way to monitor how Earth’s surface temperature is changing over time. For a deeper dive, you can explore resources like the Climate Data Primer from NOAA Climate.gov.
2023: The Hottest Year on Record – What Does This Mean for “Temperature Right Now”?
When we ask “what’s the temperature right now” in a global context, recent data provides a stark answer. According to the 2023 Global Climate Report from NOAA’s National Centers for Environmental Information, 2023 was unequivocally the warmest year on record. Every single month in 2023 ranked among the top 7 warmest for that month historically, and the latter half of the year (June through December) each set new records as the hottest ever recorded for those months. July, August, and September of 2023 were particularly notable, exceeding the long-term average by more than 1.0°C (1.8°F). This was the first time in NOAA’s records that any month has surpassed this critical threshold.
This record-breaking heat in 2023 isn’t just a statistical anomaly; it has real-world implications. The increase in global average surface temperature, even if it seems small in degrees, represents a massive amount of added heat energy trapped within Earth’s systems, primarily the oceans. The roughly 2-degree Fahrenheit (1 degree Celsius) increase since the pre-industrial era (1850-1900) is a significant accumulation of heat.
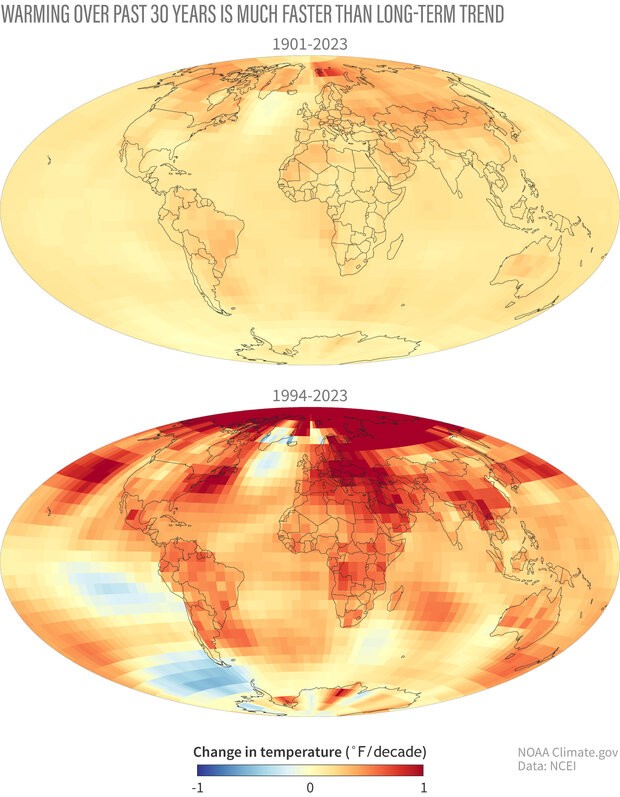
This extra heat is driving a cascade of effects around the globe. We are seeing more frequent and intense regional and seasonal temperature extremes, like heatwaves. Snow cover and sea ice are diminishing, impacting ecosystems and contributing to further warming (due to reduced reflectivity). Heavy rainfall events are intensifying in many regions, leading to increased flooding risks. Habitats for plants and animals are shifting, disrupting ecosystems as some species expand their ranges while others shrink. As temperature trends maps clearly illustrate, land areas are generally warming faster than oceans, and the Arctic region is warming at an alarming rate, far exceeding the global average.
The trends are undeniable. Recent warming is happening much faster than the long-term average. When comparing temperature trends over the past few decades (1994-2023) to the trends since the start of the 20th century (1901-2023), the acceleration is clear. Some locations are warming by 1 degree Fahrenheit or more per decade. The Arctic is experiencing the most dramatic differences, where the loss of reflective ice and snow amplifies warming in a feedback loop.
Long-Term Temperature Changes: Understanding the “Right Now” in Historical Context
While “what’s the temperature right now” can refer to a specific moment, understanding long-term trends provides crucial context. The global average temperature isn’t static; it’s been changing over decades and centuries. Though warming isn’t uniform across the planet, the overall trend is unmistakably upward. NOAA’s data shows that the combined land and ocean temperature has increased at an average rate of 0.11° Fahrenheit (0.06° Celsius) per decade since 1850, totaling about 2°F overall. Alarmingly, the rate of warming has more than tripled since 1982, reaching 0.36° F (0.20° C) per decade.
The scientific consensus, as highlighted in the Intergovernmental Panel on Climate Change (IPCC) reports, is clear: human activities are unequivocally the cause of this global warming. The burning of fossil fuels, deforestation, and other human actions release greenhouse gases into the atmosphere, trapping heat and driving up global temperatures. The IPCC’s Sixth Assessment Report states that human activities have already caused approximately 1.1°C of warming above pre-industrial levels (1850-1900) between 2011 and 2020.
Looking ahead, the future temperature trajectory depends heavily on our actions. The amount of carbon dioxide and other greenhouse gases we continue to emit will determine the extent of future warming. Currently, human activities add about 11 billion metric tons of carbon to the atmosphere each year, exceeding the Earth’s natural removal capacity and causing atmospheric carbon dioxide concentrations to rise annually.
If emissions continue to increase at the current rate, climate models project a global temperature increase of at least 5 degrees Fahrenheit (compared to the 1901-1960 average) by the end of this century, potentially reaching as high as 10.2 degrees warmer. Even if emissions slow down and begin to decline significantly by 2050, models still project a warming of at least 2.4 degrees Fahrenheit, and possibly up to 5.9 degrees warmer.
So, when you ask “what’s the temperature right now?”, remember it’s part of a much larger story. Understanding global temperature trends, the record-breaking heat of recent years, and the long-term changes driven by human activity is crucial for addressing the challenges of climate change and shaping a sustainable future. The “temperature right now” is not just a number on a thermometer; it’s a signal of a planet undergoing significant change, urging us to take action.
Key Resources
- NOAA Climate.gov
- 2023 Global Climate Report – NOAA National Centers for Environmental Information
- IPCC Reports
References
Global Carbon Project. (2023, December 4). Fossil CO2 emissions at record high in 2023. Accessed January 18, 2023, from https://globalcarbonbudget.org/fossil-co2-emissions-at-record-high-in-2023/.
NOAA National Centers for Environmental Information (2024). Annual 2023 Global Climate Report. Accessed January 17, 2024, from https://www.ncei.noaa.gov/access/monitoring/monthly-report/global/202313.
IPCC, 2021: Summary for Policymakers. In: Climate Change 2021: The Physical Science Basis. Contribution of Working Group I to the Sixth Assessment Report of the Intergovernmental Panel on Climate Change [Masson-Delmotte, V., P. Zhai, A. Pirani, S.L. Connors, C. Péan, S. Berger, N. Caud, Y. Chen, L. Goldfarb, M.I. Gomis, M. Huang, K. Leitzell, E. Lonnoy, J.B.R. Matthews, T.K. Maycock, T. Waterfield, O. Yelekçi, R. Yu, and B. Zhou (eds.)]. Cambridge University Press, Cambridge, United Kingdom and New York, NY, USA, pp. 3−32, doi:10.1017/9781009157896.001.
IPCC, 2023: Summary for Policymakers. In: Climate Change 2023: Synthesis Report. Contribution of Working Groups I, II and III to the Sixth Assessment Report of the Intergovernmental Panel on Climate Change [Core Writing Team, H. Lee and J. Romero (eds.)]. IPCC, Geneva, Switzerland, pp. 1-34, doi: 10.59327/IPCC/AR6-9789291691647.001
USGCRP, 2017: Climate Science Special Report: Fourth National Climate Assessment, Volume I [Wuebbles, D.J., D.W. Fahey, K.A. Hibbard, D.J. Dokken, B.C. Stewart, and T.K. Maycock (eds.)]. U.S. Global Change Research Program, Washington, DC, USA, 470 pp., doi: 10.7930/J0J964J6.